Home / Examples / Fluid Analysis [Bernoulli] / Example 15: Droplet Formation Analysis
The change of droplet from a rectangle to a circle by surface tension is solved with VOF method.
Volume fractions of water and air each are solved.
Unless specified in the list below, the default conditions are applied.
The 3D model is also available. The change from cube to sphere is solved.
Results will vary depending on Femtet version and the PC environment.
Item |
Settings |
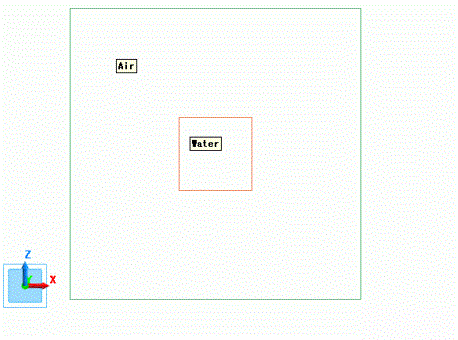
Analysis Space |
2D |
Model Unit |
mm |
Item |
Tab |
Settings |
||||||||
Solver |
Solver |
Fluid Analysis [Bernoulli] |
||||||||
Analysis Type |
Fluid Analysis |
Transient Analysis |
||||||||
Multiphase Flow Setting |
Fluid Analysis |
Execute free surface analysis (VOF method): Select Phase Setting: Register [ 000_Air] and [100_Water].
Take into Account Surface Tension: Select Phase Pair Setting:
|
||||||||
Setup Details |
Fluid Analysis Setup Details |
Control Volume Type: Cell-centered Base |
||||||||
Timestep |
Transient Analysis |
|
||||||||
Meshing Setup |
Mesh |
|
Body Number/Type |
Body Attribute Name |
Material Name |
0/Face |
Water |
100_Water * |
1/Face |
Air |
000_Air * |
* Available from the material DB
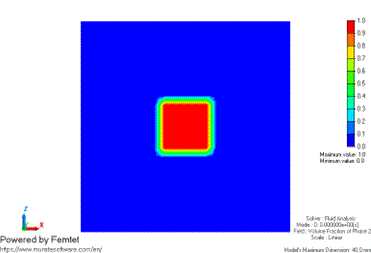
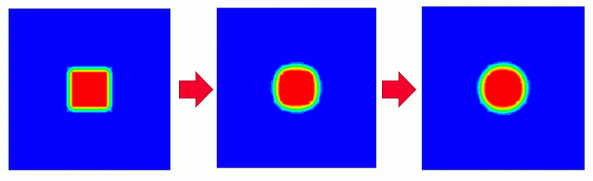
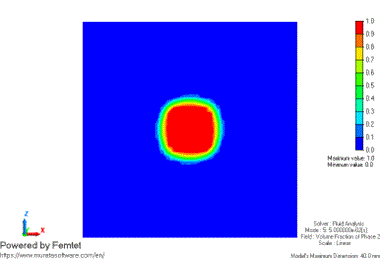
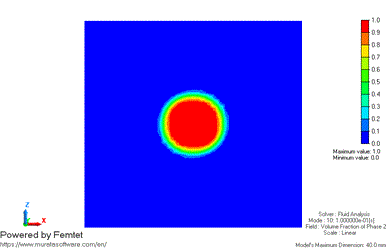
The volume fraction contours of phase 2 at 0 [s], 0.05 [s], and 0.1 [s] are shown below.
The part of phase 2 (water) is illustrated in red.
It is observed that the rectangle will change to a circle over time.
|
|
|---|---|
|
 |
|
 |
The contour of the static pressure at 0.1 [s] and the graph of the static pressure distribution that has the x range of -20 to 20 and the z fixed at 0 are shown below.
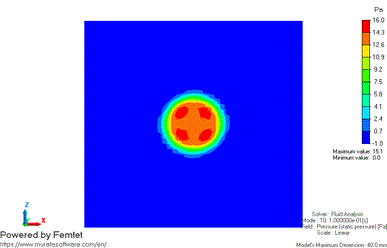
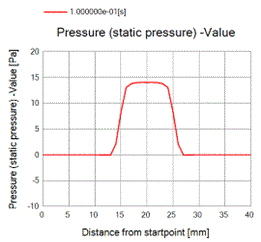
The pressure at the center of the droplet is 13.9 [Pa].
The difference in pressure across the boundary between gas and liquid is theoretically calculated with the Young-Laplace equation (Difference in Pressure = Surface Tension Coefficient / Curvature Radius).
Volume of Initial Rectangle: S = 10 x 10 = 100 [mm2]
Radius of Circle: r = ( S / π )^2 = 5.64 [mm]
ΔP = 0.07 / 5.64 x 10^-3 = 12.4 [Pa]
This is close to the theoretical value and confirms that the analysis is correctly performed.