Home / Examples / Electromagnetic Analysis [Hertz] / Example 36: Diplexer
A waveguide diplexer is analyzed.
As electromagnetic waves propagation will vary depending on frequencies, adaptive meshing is applied at multiple frequencies.
Unless specified in the list below, the default conditions will be applied.
Results will vary depending on Femtet version and the PC environment.
Item |
Settings |
Solver |
Electromagnetic Analysis [Hertz] |
Analysis Space |
3D |
Analysis Type |
Harmonic Analysis |
Unit |
mm |
Mesh and harmonic analysis are set as follows.
Tab |
Setting Item |
Settings |
||||||||||||||
| Mesh | Meshing Control |
Number of Tessellations per Wavelength: Deselect Set the number of tessellations per wavelength *1 |
||||||||||||||
Adaptive Mesh Setting |
Maximum Number of Iterations: 10 *2 Minimum Number of Iterations: 0 Select Set frequency to apply adaptive meshing
|
|||||||||||||||
Frequency-Dependent Meshing |
Reference Frequency: freq_ref × 109 [Hz] (freq_ref = 285) |
|||||||||||||||
Harmonic Analysis |
Sweep Type |
Linear Step by Frequency |
||||||||||||||
Sweep Values |
Minimum Frequency: 240 × 109 [Hz] Maximum Frequency: 300 × 109 [Hz] Frequency Step: 0.5 x10⁹[Hz] |
|||||||||||||||
Frequency Sweep |
Select Fast Sweep S-parameter Tolerance: 1x10⁻³ |
In this example, a reference frequency is set with variable. Its name is freq_ref. The initial value is 285.
*1 In this example, this option is deselected to clearly see the difference of frequencies for the adaptive meshing.
Usually, selecting this option is effective to create the optimized meshes by the adaptive meshing.
See [Meshing Control] for the detail.
*2 In this example, the maximum number of iterations is set to 10 so as to shorten the calculation time.
The adaptive meshing, however, actually does not converge with 10 iterations. The meshing will end without convergence.
Therefore, the calculation accuracy is considered not to be so high.
Increase the maximum number of iterations to converge adaptive meshing.
Body Number/Type |
Body Attribute Name |
Material Name |
33/Solid |
AIR |
000_Air(*) |
* Available from the material DB
Boundary Condition Name/Topology |
Tab |
Boundary Condition Type |
Settings |
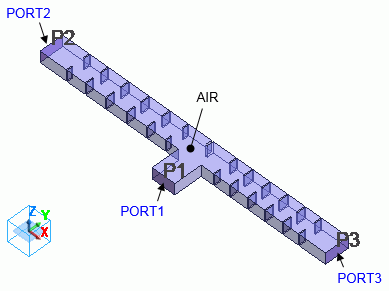
PORT1/Face |
Electric |
Port |
Integral Path: N/A Port Type: Power Port Reference Impedance: Select Use the characteristic impedance calculated from the port structure |
PORT2/Face |
Electric |
Port |
Integral Path: N/A Port Type: Power Port Reference Impedance: Select Use the characteristic impedance calculated from the port structure |
PORT3/Face |
Electric |
Port |
Integral Path: N/A Port Type: Power Port Reference Impedance: Select Use the characteristic impedance calculated from the port structure |
Outer Boundary Condition |
Electric |
Electric Wall |
|
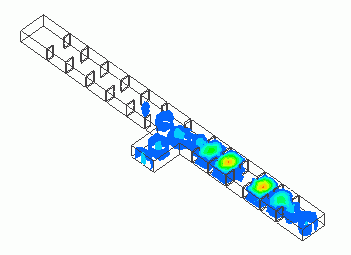
We will see how the electromagnetic waves propagate from PORT1.

Fig. 3. Electromagnetic Waves Propagation (Magnitude of Electric Field)
Fig. 3A shows the magnitude of electric field when the electromagnetic waves of 255 GHz come through PORT1.
The propagation is observed in the direction of PORT2 but not in the direction of PORT3.
Fig. 3B shows the magnitude of electric field when the electromagnetic waves of 285 GHz come through PORT1.
Unlike 255 GHz, the propagation is in the direction of PORT3, not in the direction of PORT2.
Mesh shapes are compared between the cases where adaptive meshing is applied at the reference frequency only and where it is applied at multiple frequencies.
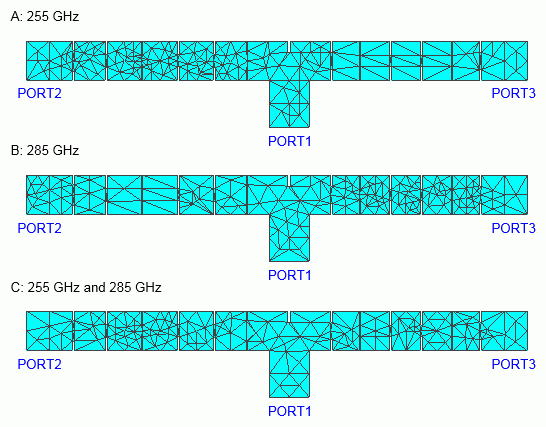
Fig. 4. Frequency for adaptive meshing and mesh shapes
Fig. 4A shows the generated meshes with the following settings.
[Apply adaptive meshing at reference frequency] is selected in [Adaptive Mesh Setting] and the reference frequency is 255 GHz (freq_ref=255).
As shown in Fig. 3A, the electromagnetic waves of 255 GHz propagate from PORT1 to PORT2, but not to PORT3.
The meshes are finer in the area between PORT1 and PORT2 where the electromagnetic waves of 255 GHz propagate.
The meshes are coarse in the area between PORT1 and PORT3 where the electromagnetic waves do not propagate.
Fig. 4B shows the generated meshes with the following settings.
[Apply adaptive meshing at reference frequency] is selected in [Adaptive Mesh Setting] and the reference frequency is 285 GHz (freq_ref=285).
As shown in Fig. 3B, the electromagnetic waves of 285 GHz propagate from PORT1 to PORT3, but not to PORT2.
The meshes are finer in the area between PORT1 and PORT3 where the electromagnetic waves of 285 GHz propagate.
The meshes are coarse in the area between PORT1 and PORT2 where the electromagnetic waves do not propagate.
Fig. 4C shows the generated meshes with the following settings.
The reference frequency is 285 GHz (freq_ref=285) and [Set frequency to apply adaptive meshing] is selected in [Adaptive Mesh Setting] and then 255 GHz and 285 GHz are specified.
The finer meshes are seen in the areas between PORT1 and PORT2 where electromagnetic waves of 255 GHz propagate.as well as between PORT1 and PORT3 where electromagnetic waves of 285 GHz propagate.
S-parameters are compared between the cases where adaptive meshing is applied at the reference frequency only and where it is applied at multiple frequencies.
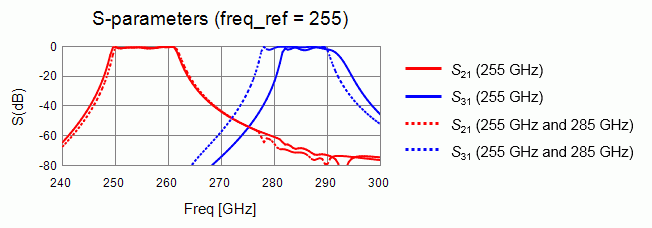
Fig. 5. Comparison of S-parameters at Reference Frequency of 255 GHz
Fig. 5 shows the S-parameters given by the adaptive meshing with the following two settings.
One setting is an adaptive meshing at the reference frequency of 255 GHz (freq_ref=255) only. The other setting is at two frequencies: 255 GHz and 285 GHz.
Solid lines represent the S-parameters with adaptive meshing at the reference frequency only. Dotted lines represent the S-parameters at two frequencies.
The red lines represent S21 and the blue lines represent S31.
The difference between two S-parameters is small at around the reference frequency of 255 GHz. The difference becomes larger as frequency moves away from 255 GHz.
As seen in 2 above, if adaptive meshing is applied at the reference frequency of 255 GHz only, the meshes do not become finer in the area where the electromagnetic waves of higher frequencies propagate.
The accuracy in such areas is degraded.
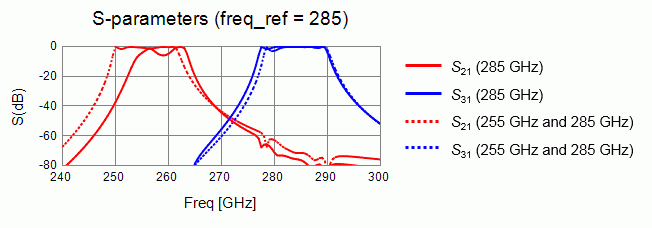
Figure 6. Comparison of S-parameters at Reference Frequency of 285GHz
Fig. 6 shows the S-parameters given by the adaptive meshing with the following two settings.
One setting is an adaptive meshing at the reference frequency of 285 GHz (freq_ref=285) only. The other setting is at two frequencies: 255 GHz and 285 GHz.
Solid lines represent the S-parameters with adaptive meshing at the reference frequency only. The dotted lines represent the S-parameters at two frequencies.
The red lines represent S21 and the blue lines represent S31.
The difference between two S-parameters is small at around the reference frequency of 285 GHz. The difference becomes larger as frequency moves away from 285 GHz.
As seen in 2 above, if adaptive meshing is applied at the reference frequency of 285 GHz only, the meshes do not become finer in the area where the electromagnetic waves of lower frequencies propagate.
The accuracy in such area is degraded.
Adaptive meshing creates optimized meshes at each frequency.
When the propagation varies greatly depending on the frequencies as in this example, if adaptive meshing is applied at the reference frequency only,
the shape of meshes may be improper for frequencies other than the reference frequency.
Meshes can be created suitable for any frequency by applying adaptive meshing at multiple frequencies according to the propagation behavior of electromagnetic waves.
See also [Adaptive Mesh Setting].