General
Home / Examples / Thermal Analysis [Watt] / Example 1: Temperature Distribution of Two Rods (Steady-State Analysis)
Two square rods with different thermal conductivities are placed closely and subjected to the common temperature boundary condition.
The temperature distribution and the heat flux vectors are solved.
Unless specified in the list below, the default conditions will be applied.
Results will vary depending on Femtet version and the PC environment.
Item |
Settings |
Analysis Space |
3D |
Model Unit |
mm |
Item |
Settings |
Solver |
Thermal Analysis [Watt] |
Analysis Type |
Steady-state Analysis |
Options |
N/A |
Two box-shape solid bodies are created. One is of gold and the other is of stainless steel (SUS301). Their thermal conductivities are different.
The temperature boundary conditions are set on the top and bottom faces.
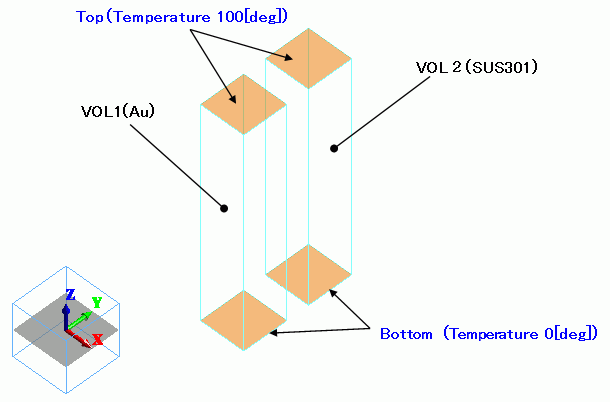
Body Number/Type |
Body Attribute Name |
Material Name |
0/Solid |
VOL1 |
002_Au * |
1/Solid |
VOL2 |
500_SUS301 * |
* Available from the material DB
Boundary Condition Name/Topology |
Tab |
Boundary Condition Type |
Settings |
Top/Face |
Heat |
Temperature |
100 [deg] |
Bottom/Face |
Heat |
Temperature |
0[deg] |
The temperature distribution is shown below.
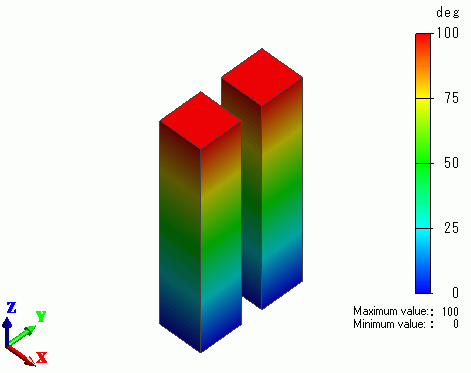
Each rod has the same temperature distribution. The thermal conductivities are irrelevant.
The vectors of the heat flux are shown below.
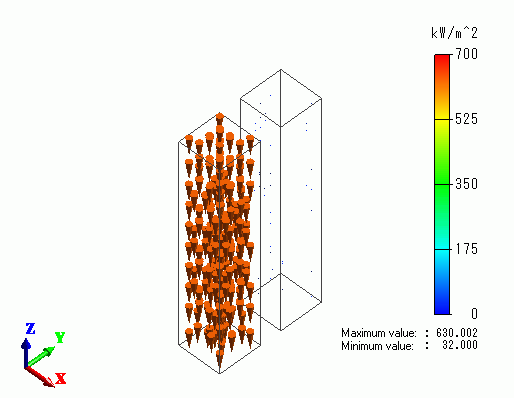
The heat flux of gold is much higher than that of SUS. This is due to the difference of the thermal conductivity.
[Thermal Conductivity] Au: 3.15x10² [W/m/deg], SUS301: 1.6x10 [W/m/deg]