CAE Software【Femtet】Murata Software Co., Ltd.

Example3 Heating of Conductive Strip (Steady-State Analysis)

General
-
Modify the tab setting of Exercise 2 and restart the transient analysis.
-
The simulation results of further timeline are obtained.
-
There are no changes in the other conditions.
Analysis Conditions
After Exercise 2 is completed, change the tab setting as follows.
The model shape, the body attributes, the material properties and the boundary conditions remain the same as Exercise 2.
|
Tabs |
Setting Item |
Settings |
|
Transient analysis |
Time step |
Manual |
|
Restart |
Select “Continue from the last session” |
|
|
Time step |
1.0^-2[s] |
|
|
Calculation steps |
10 |
Results
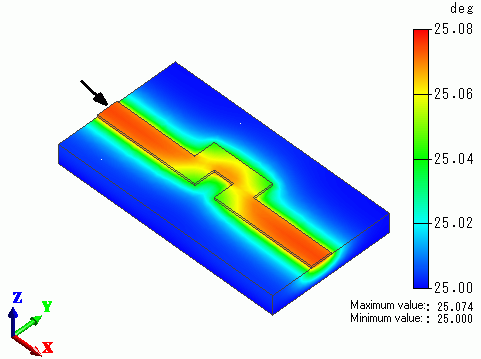
The temperature distribution at lapsed time 0.110[s] is shown below.

The temperature is slightly higher than that of Exercise 2 at lapsed time 0.010[s].
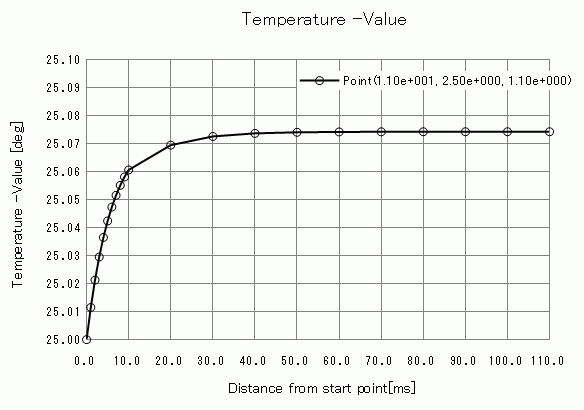
The temperature at the point indicated by arrow in the figure above is plotted for the specified time period.

The plots from 0 to 10[ms] come from Exercise 2.
The plots from 10 to 110[ms] come from Exercise 3.

