
CAE Software【Femtet】Murata Software Co., Ltd.
Example35 Minute Dipole Antenna
General
-
A minute monopole antenna is analyzed.
-
The obtained electromagnetic fields are compared with the theoretical values.
-
Unless specified in the list below, the default conditions will be applied.
Analysis Conditions
|
Item |
Setting |
|
Solver |
Electromagnetic Analysis [Hertz] |
|
Analysis Space |
3D |
|
Analysis Type |
Harmonic Analysis |
|
Unit |
mm |
Harmonic Analysis tab and Open Boundary tab are set as follows.
|
Tab |
Setting Item |
Setting |
|
Harmonic Analysis |
Sweep Values |
300×10^6[Hz] |
|
Sweep Type |
Select Single frequency |
|
|
Sweep Setting |
Select Discrete sweep. |
|
|
|
||
|
Open Boundary |
Type |
Absorbing boundary |
|
Order of Absorbing Boundary |
1st degree |
Graphical Object

Whole model Antenna
Body Attributes and Materials
|
Body Number/Type |
Body Attribute Name |
Material Name |
|
0/Solid |
PEC |
PEC ** |
|
1/Solid |
PEC |
PEC ** |
|
2/Sheet |
Imprinting body |
|
|
3/Solid |
AIR |
000_Air(dry) * |
* Available from the Material DB
** The material PEC is set as follows.
|
Material Name |
Tab |
Conductivity Type |
|
PEC |
Conductivity |
Perfect conductor |
Boundary Condition
|
Boundary Condition Name/Topology |
Tab |
Boundary Condition Type |
Setting |
|
PORT/Face |
Electric |
Port |
Current port |
|
Outer Boundary Condition |
Electric |
Open Boundary |
Select on the open boundary tab of the analysis condition setting. |
Set up Mesher/Solver
|
Setting Item |
Setting |
|
Frequency-Dependent Meshing |
Reference frequency: 300×10^6[Hz] Select “The conductor bodies thicker than the skin depth constitute the boundary condition.” |
Results
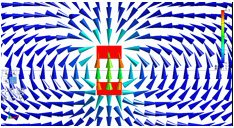
Let’s take a look at the electric field distribution on the XZ plane. The diagram below shows the electric field distribution at the phase 270 deg where the Z component of the port becomes largest.
The electric fields near the antenna are directed from the lower PEC in the negative Z
to the upper PEC in the positive Z.

Electric field distribution on XZ plane at phase 270 deg.
The obtained magnetic field distribution on the XZ plane is in the below diagram. It shows the distribution of Y components at the very moment of phase 0 deg where the downward current becomes largest.

Magnetic field distribution on XZ plane at phase 0 deg.
Next, we compare the results to the theoretical values. Theoretical equations are as follows.

j: Imaginary unit
I : Current. A calculation is done with I=1[A] since the current at the phase 0 deg flows upward or in the integral path direction of the port.
R : Distance to the observation point
k : Wavenumber
l: Length of dipole. It is set to 3[mm] which is the distance of PEC centers.
ε : Permittivity of vacuum
Eθ is calculated with the equations above and compared to the analysis results. The Z component of the electric field on the X axis is used for comparison. Phase 0 deg is for a real part and phase 270 deg is for an imaginary part.
Theoretical Z component of the electric field is given by multiplying Eθ by -1. The diagram shows they are well matched.
However, the accuracy is a bit lower in the neighborhood of small area of antenna on the X coordinate.
Let’s look at Y component. Y component on the X axis is used. On the X axis, Hφ can be regarded as Hy.
The diagram shows they are well matched.

Electric field strength outside of the analysis domain can be obtained with the surrounding electromagnetic field.
The theoretical values are compared on the X axis. dBμV/m is used as a unit for electric field, which is used for the surrounding electromagnetic field too.
On the X axis, |Eθ| , which is given by the theoretical calculation, is same as |E|. The calculation is done with an equation below.
E'[dBμV/m] = 20*log(1000000*|Eθ|/√2)
The graph below shows they are well matched outside the analysis domain (1.0<x<3.0) but not in the analysis domain.
