


|
Home / Examples / Fluid Analysis [Bernoulli] / Example 15: Droplet Formation Analysis
Example 15: Droplet Formation Analysis
General
-
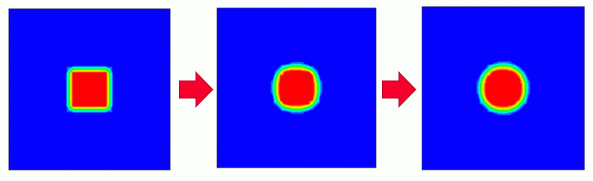
The change from a rectangular to circular droplet due to surface tension is solved by the VOF method.
-
Volume fractions of water and air each are solved.
-
Unless specified in the list below, the default conditions are applied.
-
The model is analyzed with separately both the timestep specified and the timestep adjusted automatically referring to the Courant number, respectively.
-
The 3D model is also available. The change from cube to sphere is solved.
-
Obtain this session's project file. (Right-click and choose 'Save link as')
-
Results will vary depending on Femtet version and the PC environment.
Analysis Space
|
Item |
Settings |
|
Analysis Space |
2D |
|
Model Unit |
mm |
Analysis Conditions
|
Item |
Tab |
Settings |
||||||||||||
|
Solver |
Solver Selection |
Fluid Analysis [Bernoulli] |
||||||||||||
|
Analysis Type |
Fluid Analysis |
Transient Analysis |
||||||||||||
|
Free Surface Analysis (VOF Method) |
Fluid Analysis |
Free Surface Analysis (VOF Method): Select |
||||||||||||
|
Free Surface Analysis (VOF Method) Setting |
Fluid Analysis |
Phase Setting: Register [ 000_Air] and [100_Water].
Take into Account Surface Tension: Select Phase Pair Setting:
|
||||||||||||
|
Setup Details |
Fluid Analysis Setup Details |
Control Volume Type: Cell-centered Base |
||||||||||||
|
Timestep [Manual] |
Transient Analysis |
|
||||||||||||
|
Timestep [Automatic] |
Transient Analysis |
|
||||||||||||
|
Meshing Setup |
Mesh |
|
Model
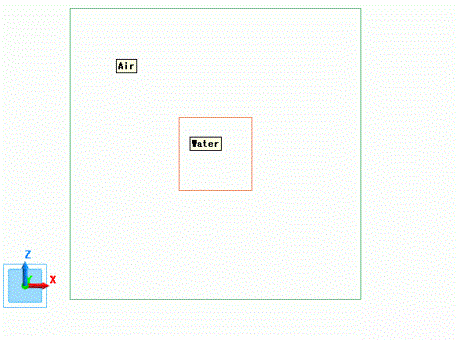
Body Attributes and Materials Setting
|
Body Number/Type |
Body Attribute Name |
Material Name |
|
0/Face |
Water |
100_Water * |
|
1/Face |
Air |
000_Air * |
* Available from the material DB
Results
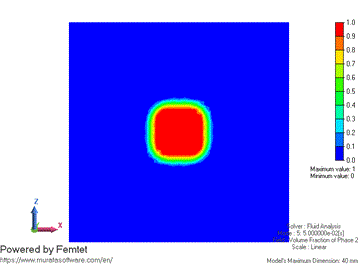
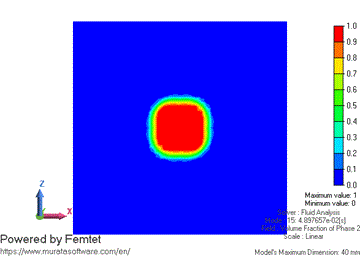
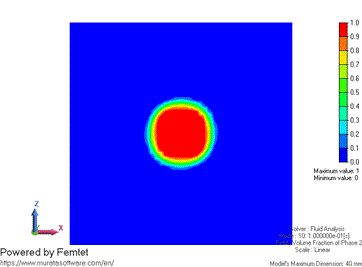
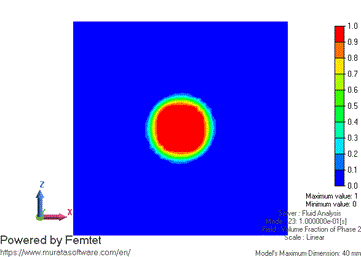
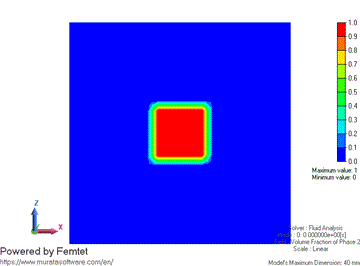
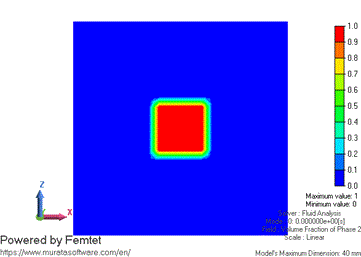
The volume fraction contours of phase 2 at 0 [s], 0.05 [s], and 0.1 [s] are shown below.
The analysis results with the timestep specified and with the timestep automatically adjusted are shown below.
The result with the timestep automatically adjusted has no data at 0.05 [s]; instead, data at near 0.05 [s] is displayed.
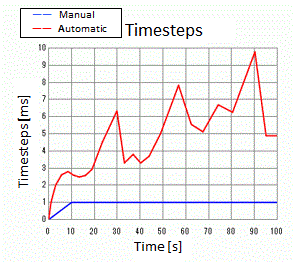
To reach 0.1 [s], the calculation with the timestep automatically adjusted only requires 23 timesteps, whereas the calculation with the timestep specified takes 100 timesteps. The more efficiently adjusted timestep allows for calculations with fewer time steps.
The part of phase 2 (water) is illustrated in red.
It is observed that the rectangle will change to a circle over time.
|
|
Timestep [Manual] |
Timestep [Automatic] |
|---|---|---|
|
|
|
|
 |
 |
|
 |
 |
The timesteps for the calculations with the timestep specified and the timestep automatically adjusted are plotted with respect to time.
The calculation with the timestep automatically adjusted takes a shorter time due to its greater timestep.
The contour of the static pressure at 0.1 [s] and the graph of the static pressure distribution that has the x range of -20 to 20 and the z fixed at 0 are shown below.
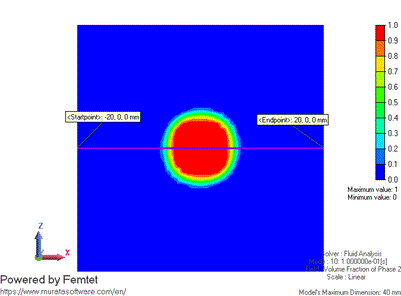
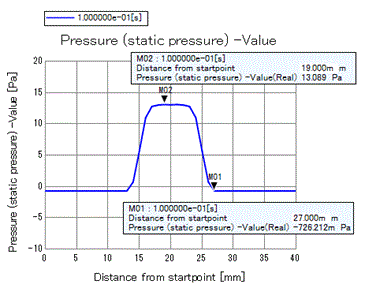
The difference in pressure between the center and outside of the droplet is 13.8 [Pa] from the maximum, 13 [Pa], and the minimum, -0.7 [Pa], of the graph.
The theoretical value of the difference in pressure between both sides of a gas-liquid boundary can be calculated using the Young-Laplace formula, difference in pressure = coefficient of surface tension/curvature radius.
Volume of Initial Rectangle: S = 10 x 10 = 100 [mm2]
Radius of Circle: r = ( S / π )^2 = 5.64 [mm]
ΔP = 0.07 / 5.64 x 10^-3 = 12.4 [Pa]
Since this is close to the theoretical value, it is confirmed that the analysis is correctly performed.