


|
Home / Examples / Stress Analysis [Galileo] / Example 12: Resonance of Metal Bars
Example 12: Resonance of Metal Bars
General
-
The model consists of three metal bars. The resonance is analyzed.
-
The deformation, the displacement distribution, and the stress distribution are solved.
-
Unless specified in the list below, the default conditions will be applied.
-
Obtain this session's project file. (Right-click and choose 'Save link as')
-
Results will vary depending on Femtet version and the PC environment.
Analysis Space
|
Item |
Settings |
|
Analysis Space |
3D |
|
Model Unit |
m |
Analysis Conditions
The analysis type is the harmonic analysis.
|
Item |
Settings |
|
Solver |
Stress Analysis [Galileo] |
|
Analysis Type |
Resonant Analysis |
|
Options |
N/A |
The resonant analysis tab is set up as follows.
|
Tab |
Setting Item |
Settings |
|
Resonant Analysis |
Number of Modes |
6 |
|
Approximated Frequency |
0 [Hz] |
Model
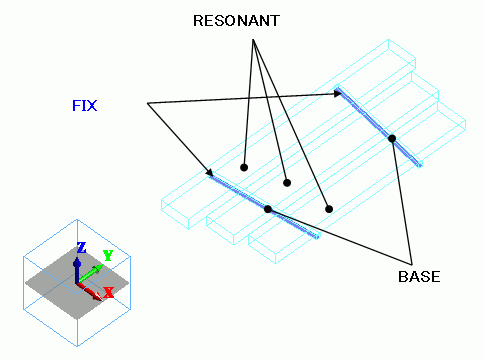
Three metal bars and two support rods are created as box-shape solid body.
The bottom faces of support rods are fixed with the displacement boundary condition.
Body Attributes and Materials
|
Body Number/Type |
Body Attribute Name |
Material Name |
|
0/Solid |
RESONANT |
001_Al * |
|
1/Solid |
RESONANT |
001_Al * |
|
2/Solid |
RESONANT |
001_Al * |
|
8/Solid |
BASE |
M_BASE |
|
9/Solid |
BASE |
M_BASE |
* Available from the material DB
The material properties are set up as follows:
|
Material Name |
Tab |
Properties |
|
M_BASE |
Elasticity |
Young's Modulus: 2×10⁹ [Pa] Poisson's Ratio: 0.3 |
|
Density |
Density: 0.1x10³ [Kg/m3] |
Boundary Conditions
The bottom faces of support rods are fixed with the displacement boundary condition.
|
Boundary Condition Name/Topology |
Tab |
Boundary Condition Type |
Settings |
|
FIX/Face |
Mechanical |
Displacement |
Select all X/Y/Z components. UX=0, UY=0, UZ=0 |
Results
The following will be output on the output window.
|
<<Eigenvalue analysis>> Eigenvalue (resonant frequency):[Hz] Mode[ 0] = 8.61552809e+002 Mode[ 1] = 1.06874655e+003 Mode[ 2] = 1.21598202e+003 Mode[ 3] = 1.24695787e+003 Mode[ 4] = 1.56876049e+003 Mode[ 5] = 1.69339225e+003 |
The resonant frequencies can be checked on Table.
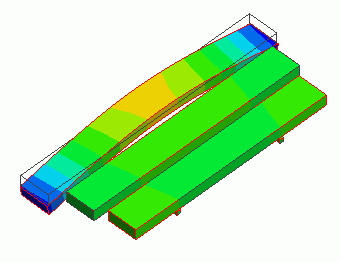
The displacement diagrams of Mode[0] to Mode[ 2] are shown below.
The contours are the Z displacement.
The minimum and maximum values are manually set to
-4.000e+000 and 4.000e+000 respectively.
Mode[0]:8.615528e+002 [Hz]
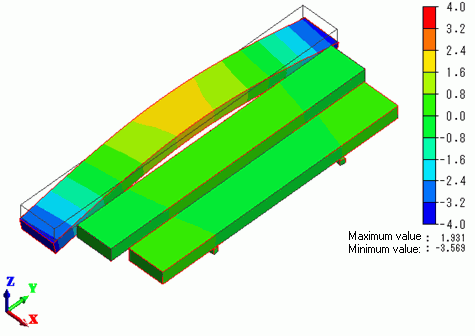
Mode[1]:1.068747e+003 [Hz]
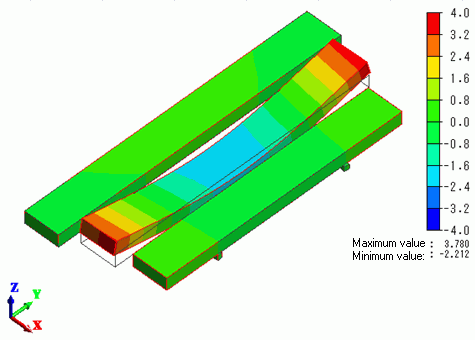
Mode[2]: 1.215982e+003 [Hz]
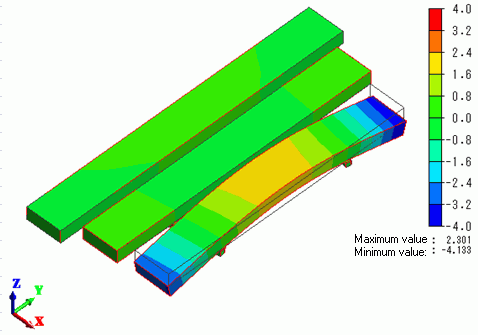
The shorter bar exhibits the higher resonant frequency.