


|
Home / Examples / Stress Analysis [Galileo] / Example 15: Harmonic Analysis of Tuning Fork
Example15: Harmonic Analysis of Tuning Fork
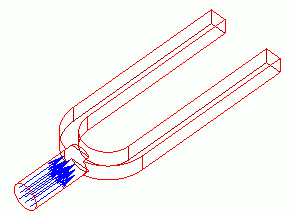
General
-
A tuning fork analyzed in Example 13 is forced to oscillate at certain frequencies.
-
The deformation, the displacement distribution, and the stress distribution are solved.
-
Unless specified in the list below, the default conditions will be applied.
-
Obtain this session's project file. (Right-click and choose 'Save link as')
-
Results will vary depending on Femtet version and the PC environment.
Analysis Space
|
Item |
Settings |
|
Analysis Space |
3D |
|
Model Unit |
m |
Analysis Conditions
The analysis type is the harmonic analysis.
|
Item |
Settings |
|
Solver |
Stress Analysis [Galileo] |
|
Analysis Type |
Harmonic Analysis |
|
Options |
N/A |
The result of Example 13 shows the fundamental resonant frequency is about 19 [Hz]. The frequency is swept around that frequency. The harmonic analysis is set as follows.
|
Tab |
Setting Item |
Settings |
|
Harmonic analysis |
Frequency |
Minimum: 500 [Hz] Maximum: 510 [Hz] |
|
Sweep Type |
Linear Step by Number of Divisions: Number of Divisions 20 |
Model
The oscillations are forcibly applied on the bottom face of the knob of the turning fork. The oscillation amplitude and direction are set with boundary conditions.
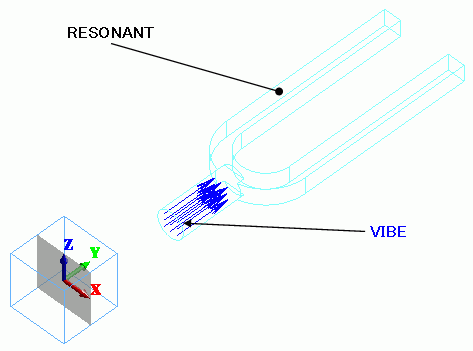
Body Attributes and Materials
|
Body Number/Type |
Body Attribute Name |
Material Name |
|
8/Solid |
RESONANT |
001_Al * |
* Available from the material DB
Boundary Conditions
In the harmonic analysis, the amplitude of the applied oscillation is set as the displacement amplitude in the boundary condition.
|
Boundary Condition Name/Topology |
Tab |
Boundary Condition Type |
Settings |
|
Oscillation/Face |
Mechanical |
Displacement |
Select the Y component. Uy=1x10⁻⁵ [m] |
The oscillation is applied in the Y direction at the bottom face of the knob. The amplitude is 10 [um].
Results
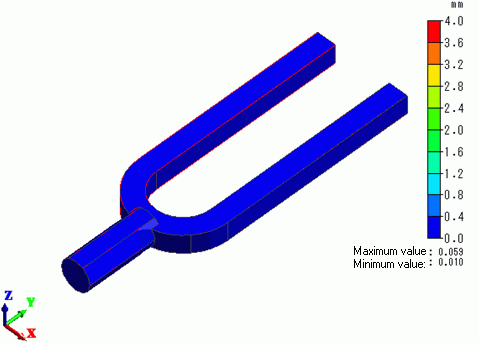
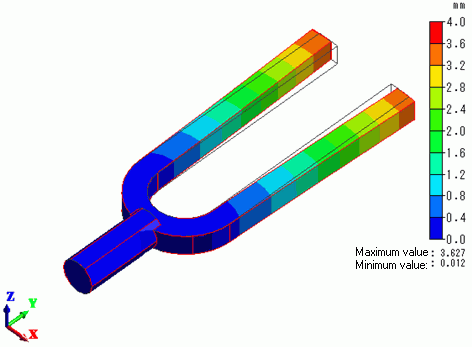
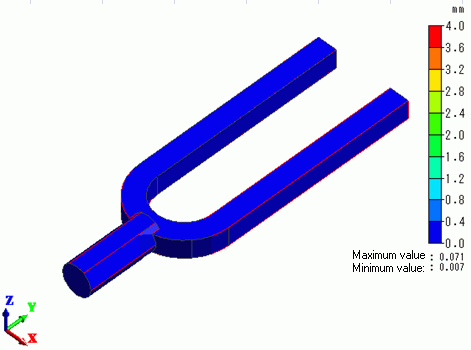
The displacement diagrams are shown below. The oscillation frequencies are 500[Hz], 505.5 [Hz] and 510 [Hz], respectively.
The contour diagram shows the displacement.
Displacements shown here are for a certain phase of the oscillation.
500 [Hz]
505.5 [Hz]
510 [Hz]
The frequency characteristics of the displacement at the tips of the tuning fork is shown below.
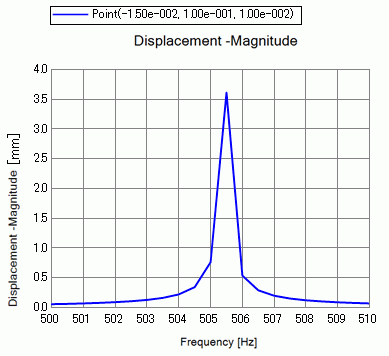
The displacement becomes quite large when the applied frequency matches the resonant frequency of the tuning fork, which is around 505.5 [Hz].