


|
Home / Examples / Stress Analysis [Galileo] / Example 73: Rigid Face Boundary
Example 73: Rigid Face Boundary
General
-
A sheet metal is in contact with a bolt and nut. The rigid face boundary is set to the bolt and nut seating surfaces. The resonance of the sheet metal is analyzed.
-
The bolt and nut seating surfaces, to which the rigid face boundary is set, vibrate in such a way that their relative displacement remains zero.
-
Obtain this session's project file. (Right-click and choose 'Save link as')
-
Results will vary depending on Femtet version and the PC environment.
Analysis Space
|
Item |
Settings |
|
Analysis Space |
3D |
|
Model Unit |
m |
Analysis Conditions
The analysis type is the harmonic analysis.
|
Item |
Settings |
|
Solver |
Stress Analysis [Galileo] |
|
Analysis Type |
Resonant Analysis |
|
Options |
None |
The resonant analysis tab is set up as follows.
|
Tab |
Setting Item |
Settings |
|
Resonant Analysis |
Number of Modes |
5 |
|
Approximated Frequency |
0 [Hz] |
Model
Two pieces of sheet metal each have a thickness of 1mm and one of them has been bent to create a bump. They are welded together, resulting in a partial gap between them. Two pieces of sheet metal are connected with a bolt across the gap.
Three analysis models are prepared for comparison. (Models 1 and 2: sheet metal only, model 3: sheet metal and bolt/nut)
Body Attributes and Materials Setting
|
Body Number/Type |
Body Attribute Name |
Material Name |
|
0/Solid |
Plate |
007_Fe * |
|
1/Solid (for model 3 only) |
Bolt |
007_Fe * |
* Available from the material DB
Boundary Conditions
The analysis model 1 has the rigid face boundary. The analysis models 2 and 3 have no boundary conditions.
|
Boundary Condition Name/Topology |
Tab |
Boundary Condition Type |
Settings |
|
Rigid/Face (for model 1 only) |
Mechanical |
Free |
Select [Rigid Face] |
Results
The following will be output on the output window or the log file.
|
<Analysis Model 1> Eigenvalue (resonant frequency):[Hz] Mode[ 0]: 1.031925e+04 Mode[ 1]: 1.256854e+04 Mode[ 2]: 1.523726e+04 Mode[ 3]: 1.835117e+04 Mode[ 4]: 2.019504e+04
<Analysis Model 2> Mode[ 0]: 4.359078e+03 Mode[ 1]: 5.203804e+03 Mode[ 2]: 5.652519e+03 Mode[ 3]: 7.282914e+03 Mode[ 4]: 7.395728e+03
<Analysis Model 3> Mode[ 0]: 1.035002e+04 Mode[ 1]: 1.259872e+04 Mode[ 2]: 1.525164e+04 Mode[ 3]: 1.839552e+04 Mode[ 4]: 2.021851e+04 |
The resonant frequencies can also be checked on the Result Table.
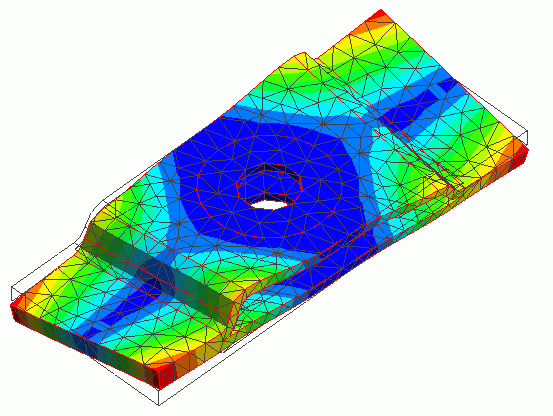
The displacement of the fundamental resonant mode, Mode[0], is shown below. The contour diagram indicates the magnitude of displacement.
Model 1: Sheet Metal Model with Rigid Face Boundary
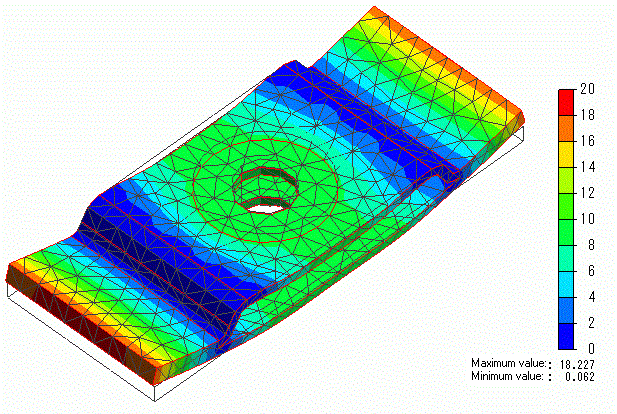
Model 2: Sheet Metal Model without Boundary Conditions
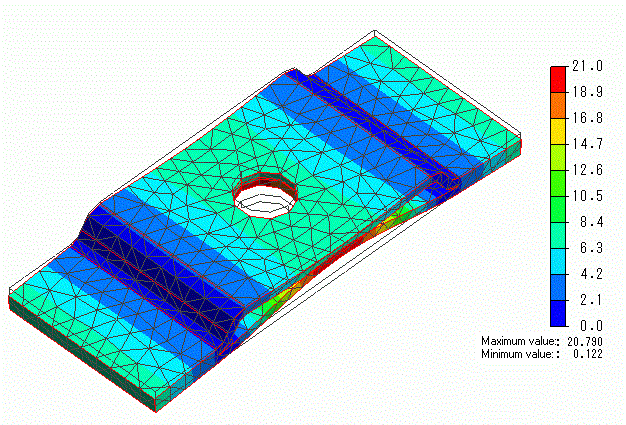
Model 3: Sheet Metal Model with Bolt/Nut without Boundary Conditions
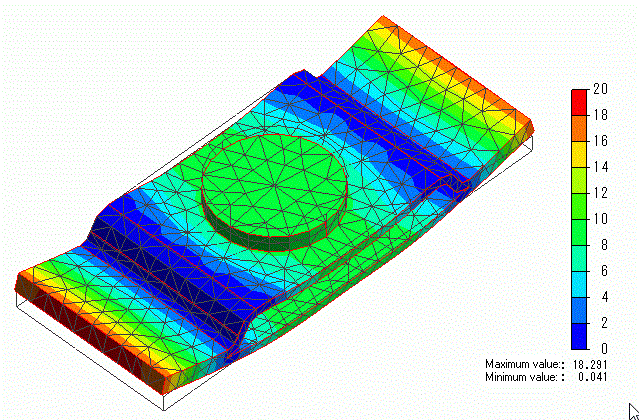
The analysis models 1 and 2 have different resonant frequencies and vibration modes.
Since analysis models 1 and 3 have nearly the same resonant frequency and similar vibration modes, the model with the rigid face boundary can simulate the model with a bolt/nut.
The bolt used for Model 3 is not an actual bolt, being very lightweight and very rigid.
Depending on the actual bolt density and Young's modulus, the resonant frequency may vary slightly. Therefore, it should be noted that rigid surface boundaries can be used to calculate vibration modes or approximate resonant frequencies.