


|
Home / Examples / Stress Analysis [Galileo] / Example 50: Harmonic Analysis of a Tower with Mechanical Loss
Example 50: Harmonic Analysis of a Tower with Mechanical Loss
General
-
A tower which has certain mechanical loss is forced to oscillate.
-
The relation between the oscillation amplitude and the mechanical loss is examined.
-
Unless specified in the list below, the default conditions will be applied.
-
The oscillation amplitude near the resonant frequency depends on the mechanical loss. Adjust the mechanical loss if needed.
-
Obtain this session's project file. (Right-click and choose 'Save link as')
-
Results will vary depending on Femtet version and the PC environment.
Analysis Space
|
Item |
Settings |
|
Analysis Space |
3D |
|
Model Unit |
m |
Analysis Conditions
The analysis type is harmonic analysis.
|
Item |
Settings |
|
Solver |
Stress Analysis [Galileo] |
|
Analysis Type |
Harmonic Analysis |
The harmonics analysis tab is set up as follows.
|
Item |
Settings |
|
Sweep Type |
Linear Step by Frequency |
|
Setting |
Minimum Frequency: 0.8 [Hz] Maximum Frequency: 1.0 [Hz] Frequency Step: 0.01 [Hz] |
Model
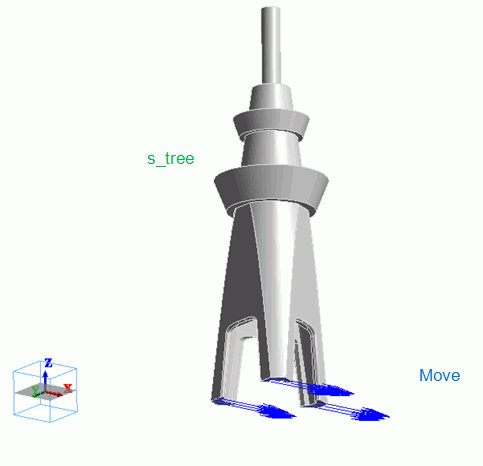
The forced X displacement is applied on the bottom of the tower. The applied displacement is set to 0.1 [m] on the bottom as boundary condition.
Body Attributes and Materials
|
Body Number/Type |
Body Attribute Name |
Material Name |
|
0/Solid |
Tower |
002_Polycarbonate(PC) * |
* Available in material DB. However the mechanical loss tangent is set to 0.1 without any bases.
Boundary Conditions
|
Boundary Condition Name/Topology |
Tab |
Boundary Condition Type |
Settings |
|
Move/Face |
Mechanical |
Displacement |
Select all X/Y/Z components. UX=0.1, UY=0, UZ=0 [m] |
Results
If the loss is considered, the displacement might not be the maximum at the phase 0° due to the phase shift. To prevent it, go to Results > Phase, where [Maximum] is selected to show the maximum displacement.
The relation between the maximum displacement at the top of the tower and the oscillation frequency is shown in the following graph.
Three curves shown in this graph are obtained using different mechanical loss tangent (tanδ) values: 0.05, 0.1, and 0.2.
1/Qm, which is shown in the graph, corresponds to the mechanical loss tangent (tanδ).
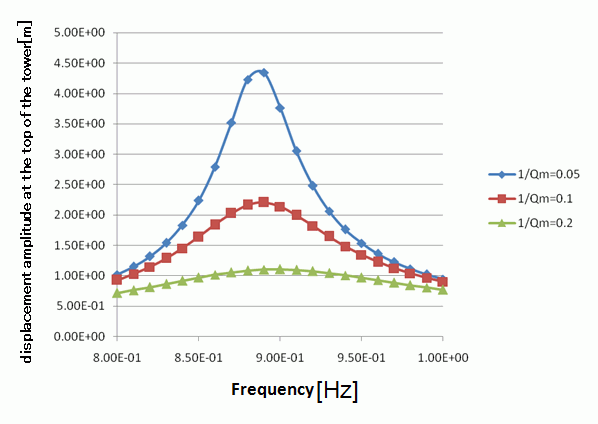
When larger mechanical loss tangent (tanδ) value is set, the shape of the curve becomes flatter.
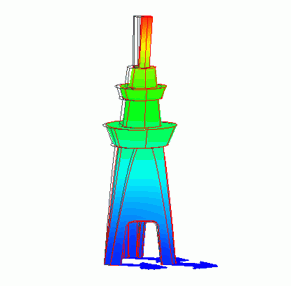
The displacement diagram and contour at an oscillation frequency of 0.88 Hz, with the mechanical loss tangent (tanδ) set to 0.1, are shown below.
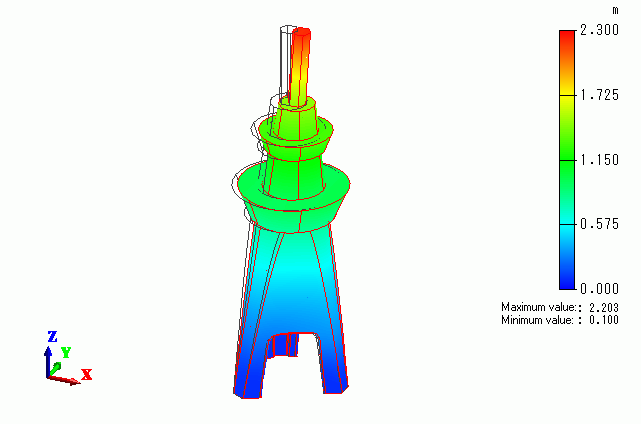
While the amplitude applied on the bottom of the tower is 0.1 [m], the amplitude of the generated oscillation is 2.2 [m] at the top of the tower.
Note: Resonant analysis is available by changing the analysis type to resonant analysis. The resonant frequency will be given. It should be noted that the displacement acquired is relative.