


|
Home / Examples / Stress Analysis [Galileo] / Example 51: Deformation of Viscoelastic Bar
Example 51: Deformation of Viscoelastic Bar
General
-
The model is a bar made of viscoelastic plastic, polystyrene. It is forced to bend.
-
The bar is subjected to the temperature change below and over the glass transition temperature.
-
Unless specified in the list below, the default conditions will be applied.
-
Obtain this session's project file. (Right-click and choose 'Save link as')
-
Results will vary depending on Femtet version and the PC environment.
-
The viscoelastic analysis is a special option.
Analysis Space
|
Item |
Settings |
|
Analysis Space |
3D |
|
Model Unit |
mm |
Analysis Conditions
The bar is subjected to the temperature change below and over the glass transition temperature.
Select [Thermal Load].
|
Item |
Settings |
|
Solver |
Stress Analysis [Galileo] |
|
Analysis Type |
Static Analysis |
|
Options |
Select Thermal Load |
The Step/Thermal Load tab is set as follows.
|
Tab |
Setting Item |
Settings |
|||||||||||||||||||||||||||||||
|
Step/Thermal Load |
Step Setting |
Multi-step Thermal Load Analysis |
|||||||||||||||||||||||||||||||
|
Time Setting |
Set up |
||||||||||||||||||||||||||||||||
|
Reference temperature |
25 [deg] |
||||||||||||||||||||||||||||||||
|
Step/Reached Temperature Setting |
|
||||||||||||||||||||||||||||||||
|
Options for the Multi-Step Analysis |
Save the results of substeps : Select |
The reference temperature (non-stress temperature) is 25 [deg]
Time setting is required in the viscoelasticity analysis. Select [Multiple steps] for the step setting and [Set up] for the time setting,
and set the time, substeps, and reached temperature for the step/reached temperature setting.
Each step below consists of 5 substeps.
Step 1 : 60 [s] : The load is increased gradually for 1 min.
Step 2 : 3540 [s] : The load is sustained for almost 1 hour.
Step 3 : 3600 [s] : The load is decreased gradually for 1 min.
Step 4 : 3660 [s] : The temperature is increased to 120 [deg] in 1 min.
Step 5 : 3720 [s] : The load is increased gradually for 1 min.
Step 6 : 7200 [s] : The load is sustained for almost 1 hour.
Step 7 : 7260 [s] : The load is decreased gradually for 1 min.
Save results of substeps is selected by default to output all the results at substeps.
Model
The model is a box solid body with a thickness of 0.4 mm. The material is polystyrene.
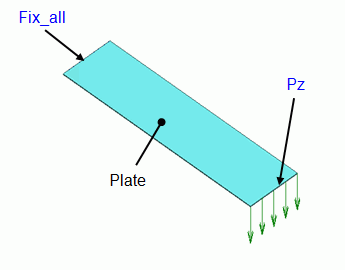
Body Attributes and Materials
|
Body Number/Type |
Body Attribute Name |
Material Name |
|
0/Solid |
Plate |
PS |
The material properties for PS are set up as follows:
|
Material Name |
Tab |
Properties |
|
PS |
Elasticity |
Material Type: Elastic/Isotropic Temperature Dependency: None Material Property: Young's Modulus: 1.39x10⁹ [Pa] Poisson's Ratio: 0.35 |
|
Viscoelasticity |
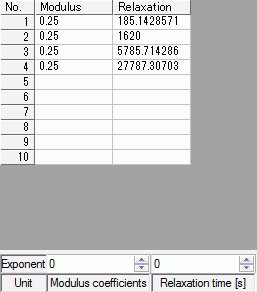
Defined by: Prony Series [Coefficient Input] Relaxation Component: Shear Only Relaxation Table:
Temperature Dependency and Shift Function: WLF Reference Temperature: 113 [deg] C1: 8.86 C2: 101.6
|
|
|
Coefficient of Linear Thermal Expansion |
0X10-6-6 [1/deg] |
Boundary Conditions
|
Boundary Condition Name/Topology |
Tab |
Boundary Condition Type |
Settings |
|
Fix_all/Face |
Mechanical |
Displacement |
Select all X/Y/Z components. UX=0, UY=0, UZ=0 |
|
Pz/Edge |
Mechanical |
Distributed Edge Load |
Select [Set the total load]. X=0, Y=0, Z=-1.0x10⁻²
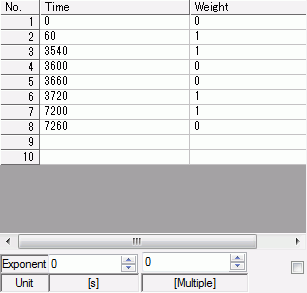
Select [Time Dependency] and set [Weight function] as follows.
This setting means the following. 60 [s] : The load is increased gradually for 1 min. 3540 [s] : The load is sustained for almost 1 hour. 3600 [s] : The load is decreased gradually for 1 min. 3720 [s] : The load is increased gradually for 1 min. 7200 [s] : The load is sustained for almost 1 hour. 7260 [s] : The load is decreased gradually for 1 min. |
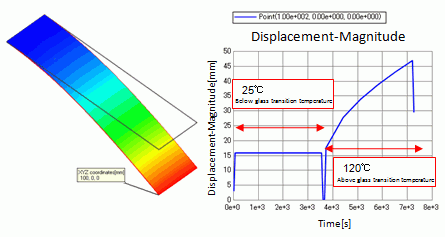
Results
Below are the diagrams of displacements at time 3540 s (about one hour after retaining the bending at 25°C) and
at time 7200 s (about one hour after retaining the bending at 120°C).
The magnitude of displacement is shown.
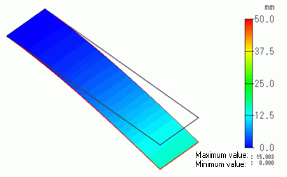
Displacement at 3540 [s] (Temperature: 25 [deg])
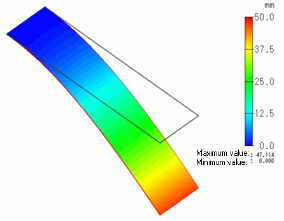
Displacement at 7200 [s] (Temperature:120 [deg])
The deformation is larger at 120 [deg], even though the mechanical load is the same as that of 25 [deg].
The graph below shows the displacement of the plate tip.
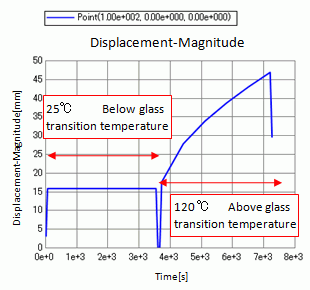
The displacement is constant at 25 [deg].
If unloaded, it returns to the original state.
The displacement increases at 120 [deg] even though the load is constant.
If unloaded, it doesn't return to the original state.