


|
Home / Examples / Coupled Analysis / Thermal-Stress Analysis [Watt/Galileo] / Example 5: Temperature Dependency of Coefficient of Thermal Expansion
Example 5: Temperature Dependency of Coefficient of Linear Thermal Expansion
General
-
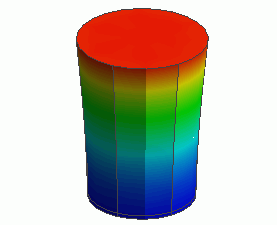
The model is a cylinder of a material having a temperature-dependent coefficient of linear thermal expansion.
The cylinder is subjected to a thermal load of temperature variation.
-
The deformation, the displacement distribution, and the stress distribution are solved.
-
Unless specified in the list below, the default conditions will be applied.
-
Obtain this session's project file. (Right-click and choose 'Save link as')
-
Results will vary depending on Femtet version and the PC environment.
Analysis Space
|
Item |
Settings |
|
Analysis Space |
3D |
|
Model Unit |
mm |
Analysis Conditions
Select Thermal analysis and Stress analysis.
|
Item |
Settings |
|
Solver |
Thermal Analysis [Watt] |
|
Thermal-Analysis Type |
Steady-state Analysis |
|
Options |
N/A * |
The Step/Thermal Load tab is set as follows.
|
Tab |
Setting Item |
Setting |
|
Step/Thermal Load * |
Reference Temperature |
0 [deg] |
* The reached temperatures come from the thermal analysis.
Model
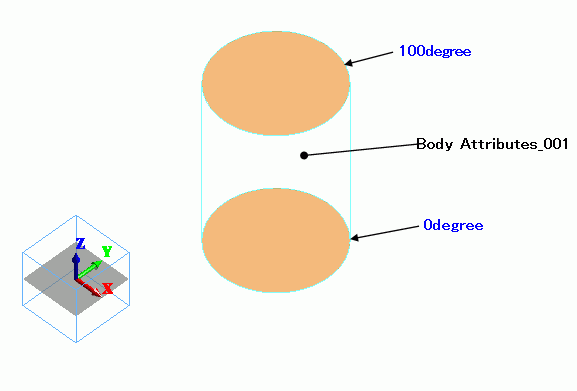
A cylindrical solid body is defined. The material is set with temperature-dependent coefficient of linear thermal expansion.
The cylinder's top and bottom faces are set with different temperature by the "temperature" boundary
condition.
Body Attributes and Materials
|
Body Number/Type |
Body Attribute Name |
Material Name |
|
0/Solid |
Body_Attribute_001 |
Material_Property_001 |
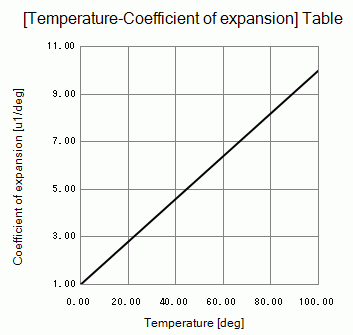
Temperature dependency of coefficient of linear thermal expansion is set on the nonlinear table.
|
Material Name |
Tab |
Settings |
|||||
|
Material_Property_001 |
Thermal Conductivity |
1 [W/m/deg] |
|||||
|
Elasticity |
Young's Modulus: 1×10⁹ [Pa] |
||||||
|
Coefficient of Linear Thermal Expansion |
Temperature Dependency: Select Yes
[Temperature-Coefficient of Linear Thermal Expansion] Table *
* This is not the actual material's property. |
Press the [Graph] button in the [Edit Nonlinearity Table] tab.
The following graph will appear. The nonlinearity can be confirmed.
Boundary Conditions
Thermal analysis is performed based on the boundary conditions below. The resulting temperature distribution is forwarded to stress analysis.
|
Boundary Condition Name/Topology |
Tab |
Boundary Condition Type |
Settings |
|
100degree/Face |
Thermal |
Temperature |
100 [deg] |
|
0degree/Face |
Thermal |
Temperature |
0 [deg] |
Results
The temperature distribution as a result of 'Watt' is shown below.
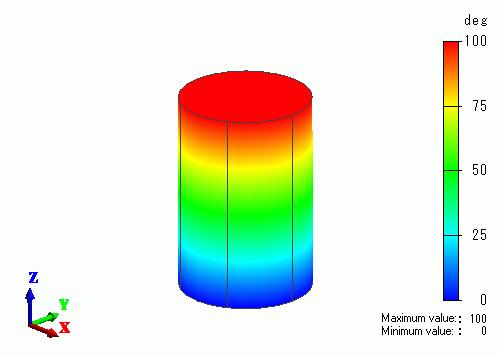
The vectors of the strain are shown below.
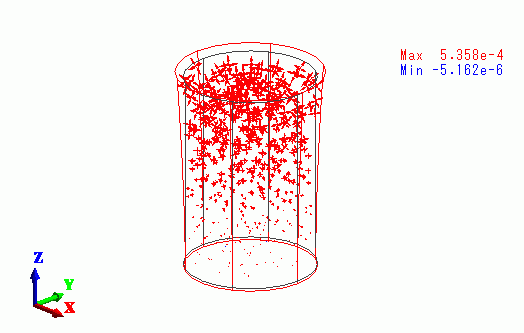
The strain is greater towards the top face.
The vectors of the stress are shown below.
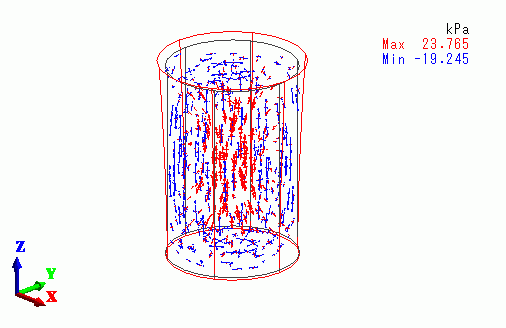
The inner area is getting the tensile stress, whereas the outer area is getting the compressive stress.