General
Home / Examples / Stress Analysis [Galileo] / Example 27: Sphere Contacting Rigid Wall
A sphere contacts a contact face of a flat rigid wall. The pressure at the contact face is analyzed.
The result matches the Hertz's theory quite well.
Unless specified in the list below, the default conditions will be applied.
Results will vary depending on Femtet version and the PC environment.
Item |
Settings |
Analysis Space |
Axisymmetric |
Model Unit |
mm |
Axisymmetric analysis is applied on a quarter model.
Item |
Settings |
Solver |
Stress Analysis [Galileo] |
Analysis Type |
Static Analysis |
Options |
Select None * |
* Hertz theory is applied for the minute contact face. [Large Deformation] should not be opted.
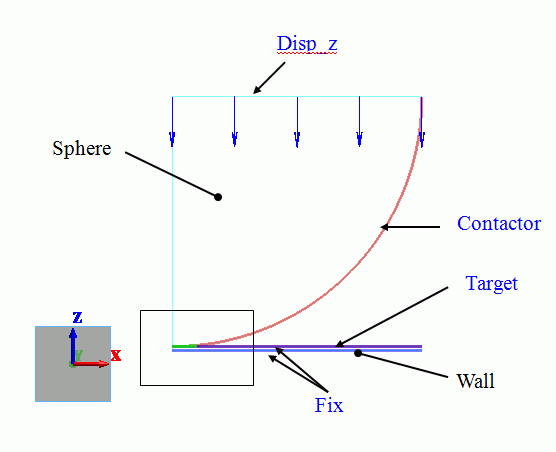
To make the analysis simple, a 2D hemisphere is applied. As it is symmetric over Z axis, just a half of the hemisphere is created.
The hemisphere is a sheet body on XZ plane. The upper edge is set with the forced displacement boundary condition.
The top and bottom of the rigid plane (Wall) are fixed.
The sphere and the rigid plane contact at a point on Z axis
The perimeter of Sphere is "Contactor". The top of Wall is "Contactee".
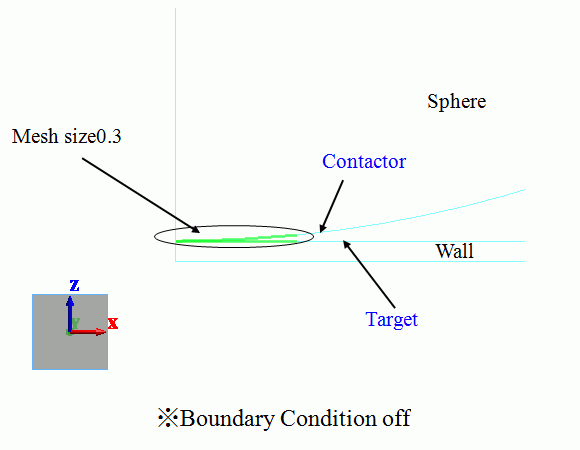
Larger stresses are expected in the area near the contact point, where the mesh size is set to 0.3, which is much finer than the general mesh size of 1.5.
The other bodies are set with a mesh size of 0.3.
A blown up image is shown below.
Setting Item |
Settings |
General Mesh Size |
1.5 |
Meshing Control |
Select Place middle nodes of the 2nd-order elements on curves |
Middle nodes will make the simulation more accurate.
Body Number/Type |
Body Attribute Name |
Material Name |
1/Sheet |
Wall |
WallMtl |
3/Sheet |
Sphere |
007_Fe * |
* Available from the material DB
The material properties are set up as follows:
Material Name |
Tab |
Properties |
WallMtl |
Elasticity |
Young's Modulus: 1×10²⁰ [Pa] Poisson's Ratio: 0 |
The top edge of Sphere is set with the forced displacement boundary condition (Disp_z) of -0.1 [mm].
Boundary Condition Name/Topology |
Tab |
Boundary Condition Type |
Settings |
Fix/Edge |
Mechanical |
Displacement |
Select the XZ component. UX=0, UZ=0 |
Disp_z/Edge |
Mechanical |
Displacement |
Select the Z component. Uz=1x10⁻⁴-4 [m] |
Contactor/Edge |
Mechanical |
Contact Surface |
Select [Contactor Surface]. |
Target/Edge |
Mechanical |
Contact Surface |
Select [Contactee Surface]. |
The contactor and contactee surfaces are designated as a contact pair in the [Boundary Pair] dialog box. In contact analyses, the contact surfaces must be designated as a boundary pair.
The simulation is divided in 20 substeps. The displacement becomes larger gradually in steps.
20 results are output for each step between 0.05 [Step] and 1 [Step].
The number of substeps is 20 by default. It can be adjusted on the Step/Thermal Load tab.
All the results of substeps are output by default. Only the final result of 1 [Step] can be output too.
The displacement at 1 [Step] is shown below.
The contour indicates the Z normal stress. The scale adjustment is true scale.
The minimum and maximum values of the contour diagram are -9 G and 9 G, respectively.
[Full Model] is selected to view the other half as well.
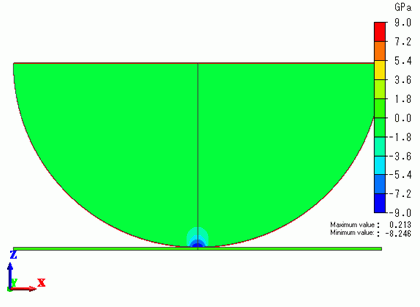
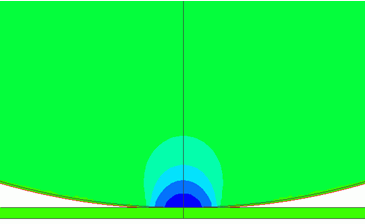
The stresses are concentrating in the contact area.
The contact area is enlarged to show the magnitude of the pressure at the contact face as follows.
The value at the coordinates of contact point (0,0,0) can be shown with [Results at Specified Coordinates].

The sphere is in contact with the rigid plane around the contact point.
The maximum value of pressure at the contact face is 8.246 [GPa].
According to Hertz's theory,
Total load: F = (16/9*(E/(1-nu^2))^2*R*d^3)^(1/2)
Contacting face radius: a = (3*F/4*(1-nu^2)/E*R)^(1/3)
Maximum pressure at the contact face: pmax = 3*F/(2*pi*a^2)
where E, ν, R and d are Young's modulus, Poisson's ratio, radius, and displacement respectively.
From this model condition (E = 2.06 x 10^11, ν = 0.26, R = 0.03, d = 1.0 x 10^-4) ,
pmax = 8.216 [Gpa] is obtained. It is well matched with the simulation result.
According to Hertz's theory, the contact area's pressure is given by the equation below.
p = pmax * (1 - (r/a)^2 )^(1/2)
The chart below indicates that the simulation result and Hertz's theory match quite well.
The stresses along a edge can be obtained by selecting a edge and selecting [Output Node Results by CSV] on the right-click menu.
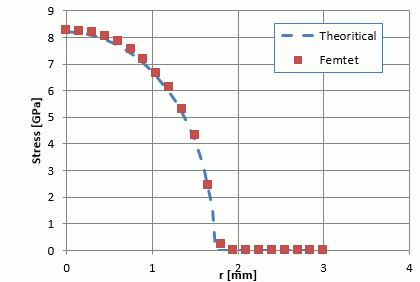
The graph above shows the simulation result and Hertz's theory match well over the entire contact face.