General
Home / Examples / Stress Analysis [Galileo] / Example 46: Energy Release Rate Calculated by J Integral
A plate with a crack is expanded and the stresses are analyzed.
The energy release rate is calculated by J integral.
Advantages compared to Example 34 are as follows: multiple models in accordance with the crack propagation are not needed,
the energy release rate of the crack tip is obtained at multiple locations, and the direction of the crack propagation can be determined.
Unless specified in the list below, the default conditions will be applied.
Results will vary depending on Femtet version and the PC environment.
Item |
Settings |
Analysis Space |
2D |
Thickness in Depth Direction |
1000 [mm] |
Model Unit |
mm |
Item |
Settings |
Solver |
Stress Analysis [Galileo] |
Analysis Type |
Static Analysis |
Options |
N/A |
The model is identical to the one in Example 34: Energy Release Rate.
In Example 34, just a quarter region at the upper right is analyzed.
In this example, the whole model is analyzed because J integral needs to be executed for a path encircling the crack.
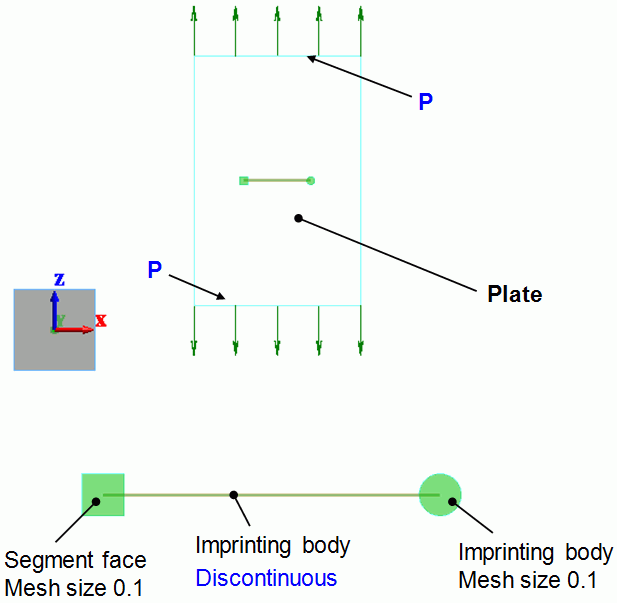
The crack is a wire body defined as imprinting body.
To make this example informative, the J integral paths for the left and right ends are set differently.
To show that the shapes of the integral path don't affect the simulation, they are shaped differently too.
< The left end >
Create a rectangle sheet body and imprint it on "Plate" body. The imprinted rectangle outline will be used as a J integral path for the left end. See Segment Face for more information.
< The right end >
Create a circular sheet body, set the mesh size and define it as imprinting body.
Imprinting will be performed automatically while meshing. See How to Set Body Attribute Partially
Body Number/Type |
Body Attribute Name |
Material Name |
0/Sheet |
Plate |
Fe |
Set Young's modulus and Poisson's ratio.
Material Name |
Young's Modulus |
Poisson's Ratio |
PlateMat * |
70.56X10⁹ [Pa] |
0.33 |
*Depends on the material.
Boundary Condition Name/Topology |
Tab |
Boundary Condition Type |
Settings |
Discontinuous/Edge |
Symmetry/Continuity |
Discontinuous |
N/A |
P/Edge |
Mechanical |
Pressure |
-98X106 [Pa] |
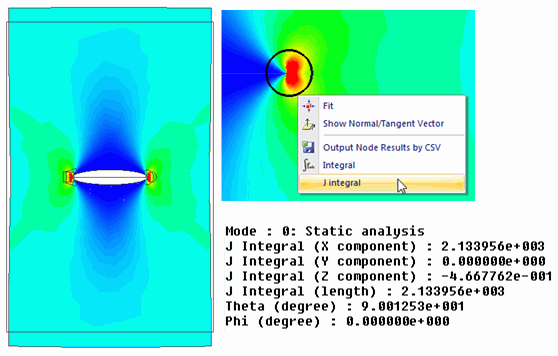
The gradation contour diagram of maximum principal stresses around the right end is shown below.
The color scale range is 0 to 400 MPa.
The calculated stresses are quite large. However they are neither accurate nor valid because they are supposed to be infinite theoretically as mentioned above and affected heavily by the shape of the mesh. (The stresses calculated at the locations more than several mesh sizes away from the end are valid.) To see the tendency of the crack growth, the energy release rate calculated by J integral should be examined.
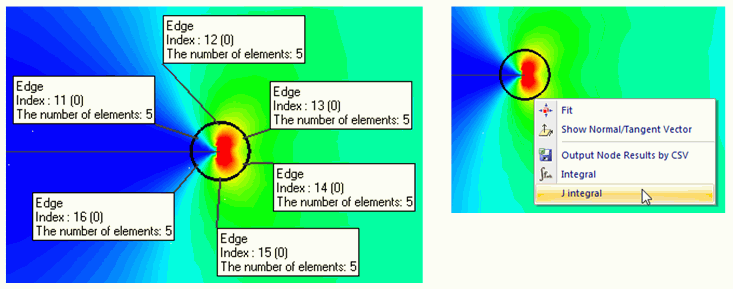
Select the edges surrounding the right end (edge index: 16,15,14,13,12,11) and select [J integral] from the right-click menu.
The calculated J-integral vector will show up on the output window. The inner product of J-integral vector and the unit vector which indicates the crack growth direction is the energy release rate. Therefore the direction of J-integral vector is most likely that of the crack growth. The length of the J-integral vector is the energy release rate generated by the crack growth in the J-integral vector direction.
(Note) J integral is available only when the stress is set as field type.
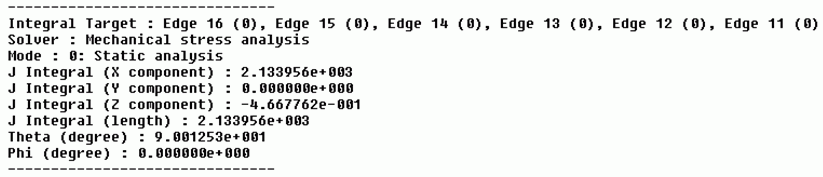
The magnitude is 2133.956 which is close to 2155.482 shown in the example 34.
The direction indicated by θ = 90 deg and φ = 0 deg is shown on the following figure.
See [Components of Strain Energy Release Rate] in J Integral for details.
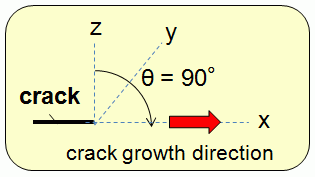
The direction of J-integral vector is the positive X direction. It indicates the crack will propagate straight along the original crack direction.
The gradation contour diagram of maximum principal stresses around the left end is shown below.
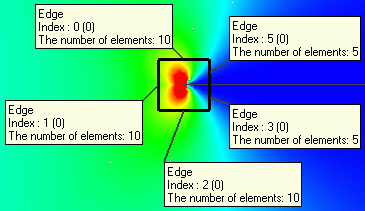
Select the edges surrounding the crack tip (edge index: 3,2,1,0,5) and select [J integral] from the right-click menu.
The calculated J-integral vector will show up on the output window. The inner product of J-integral vector and the unit vector which indicates the crack growth direction is the energy release rate. Therefore the direction of J-integral vector is most likely that of the crack growth. The magnitude of the J-integral vector is the energy release rate generated by the crack growth in the J-integral vector direction.
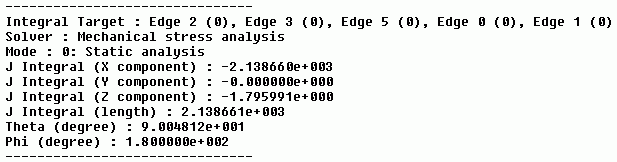
The length of the vector is 2138.661. It is about the same as that of the right end calculated in the previous step (2133.956) despite the difference of the shape of J integral path.
The direction indicated by θ = 90 deg and φ = 180 deg is shown on following figure.
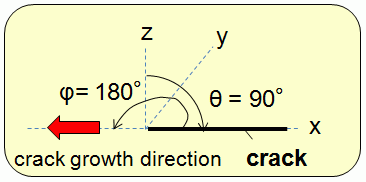
The direction of J-integral vector is the negative X direction. It also indicates the crack will propagate straight along the original crack direction.