


|
Home / Show Results / Result Field / Vector Diagram
Vector Diagram
On the [Results] tab,

click either [Vector] or
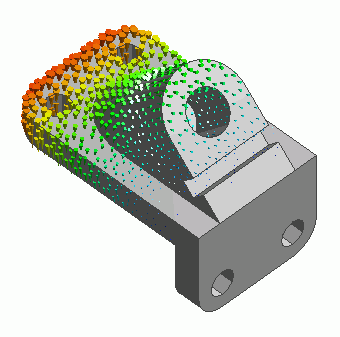
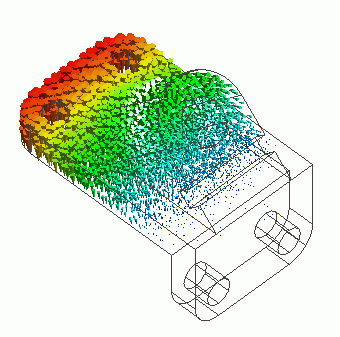
or  . The vector diagram shows the field with arrows.
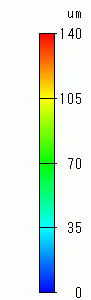
The vectors' color and length vary depending on the magnitude of the field.
The vector will be longer for larger field values.
Surface vector diagram Surface vector diagram Color scale
Results to Display
In the selection box below, select the Field Type, Component, Phase, and Scale.

Display Setting
|
|
Click [Graphics Setup] and the resulting field is displayed. [Vector] tab is for the setting of vector display.
At Vector Shape, the shape of vector can be changed.
If you feel there are too many vectors on display, go to Display and enable Thin Out and enter the ratio.
Vectors are positioned at the center of the elements. By selecting Grids, however, vectors on orthogonal grids can be displayed.
Grids button is hidden and not selectable.
Get the right click menu while selecting bodies, and click [View]-[Outline Width]. You can set the width of outlines.
Further details are explained at each dialog's Help. |
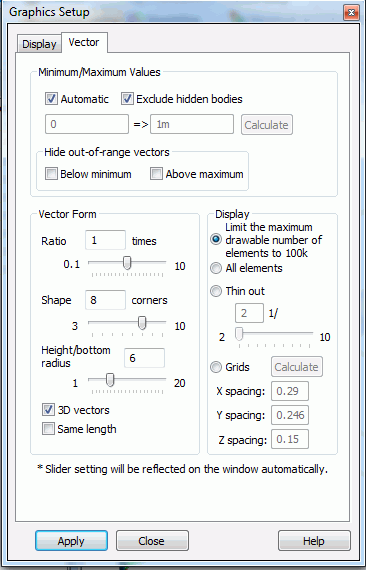
 . The dialog to set up the graphics