


|
Home / Show Results / Characteristics by Charts / SYZ Matrix / How to Renormalize
How to Renormalize
 |
|
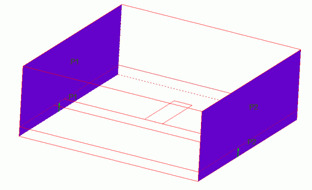
Figure 1: Analysis model (open stub) |
The renormalization operation is explained with the open stub given as an example.
Be aware that this example is slightly modified from the example 8 of Hertz for faster calculation.
The ports' reference impedances are 50 ohms In the original model, whereas they are changed as follows for the easy explanation.
For Port 1, select "Use the characteristic impedance calculated from the port structure".
For Port 2, set 50Ω as in the example.
Run the solver under this setting and activate the SYZ Matrix.

Figure 2: SYZ Matrix
Go to [Edit] and select [Renormalize]. The Renormalize dialog box like Fig.3 will show up.
On this dialog box,
"PORT1:m1 48.57+j 0.00" is Port 1
"PORT2:m1 50.00+j 0.00" is Port 2
48.57 of Port 1 and 50.00 of Port 2 are the reference impedances of each.
The Port 1 result is its characteristic impedance and the Port 2 result indicates the specified value itself.
These are reflecting the setting.
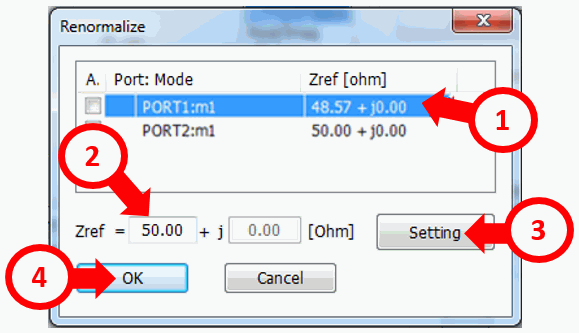
Figure 3: ReNormalize dialog box
Fig.3 shows how to change the reference impedance from the characteristic impedance to the desired value.
-
Select the port
-
Enter the desired reference impedance
-
Click [Set Z0]
-
Press the [OK] button
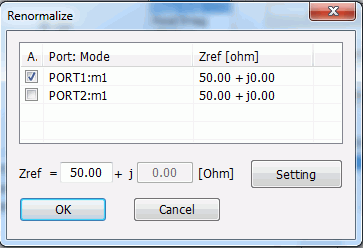
Figure 4: ReNormalize dialog box
Fig.4 is the result of the operations above.
Apply is selected and the reference impedance is changed to 50 Ω from 48.57Ω.
If Apply on the left side is selected, renormalized value is shown.
If it is not selected, renormalized value is not shown.
Press the [OK] button at 4) in the Fig.3, and see the S-parameter graph.
You will be able to confirm the renormalization.
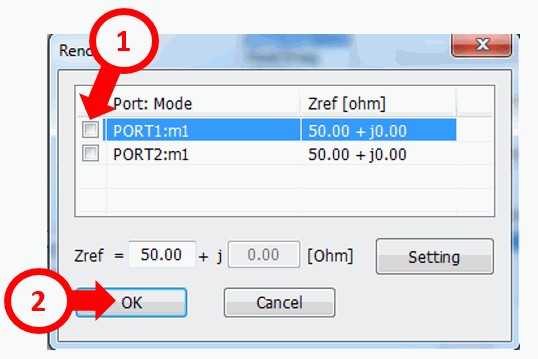
Figure 5: ReNormalize dialog box
Let's take a look at Fig.5, and learn how to get back to the original impedance from 50 ohms.
-
Deselect Apply.
-
Press the [OK] button
Press the [OK] button at 2) in the Fig.3, and see the S-parameter graph.
You will be able to confirm that the graph get back to the original plot before the renormalization.
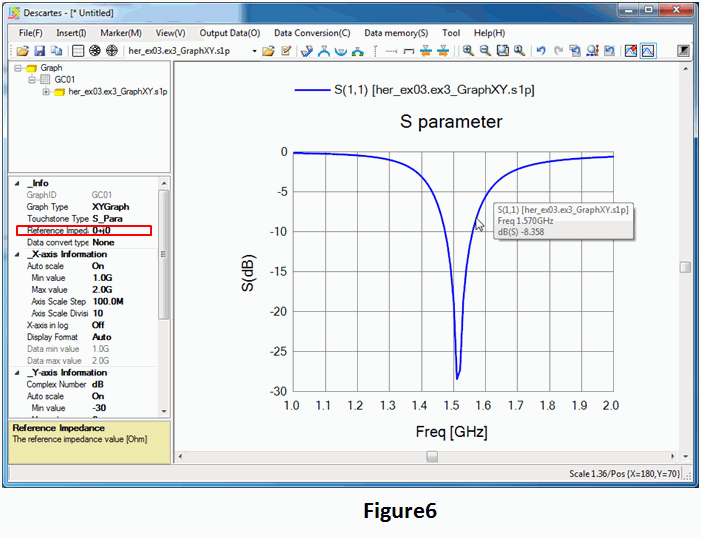
The difference can be observed on the graph too. Since the ports reference impedances are not equal, 0 will be given to the reference impedance on the graphing property information. (as indicated by the red arrow in Fig.6)

If all the ports reference impedances are equal to 50ohms, the graphing property information will indicate 50 ohms.