|
Home / Technical Notes / Fluid Analysis/Fluid-Thermal Analysis / Porous
Porous Medium Setting
An idea of how to set the porous medium for the fluid analysis is explained.
See the Fluid tab for more information.
1. How to Set Coefficient
There are four methods for the porous medium setting: 1st-order equation, 2nd-order equation, exponentiation, and calculation from porosity.
[Calculate from porosity] only requires porosity for the analysis.
The coefficient of porous medium is automatically calculated.
The analysis is applicable when large number of particles are in the air domain.
For other cases, the analysis is not applicable.
How to acquire the coefficients of the 2nd order equation is explained as follows. The same method applies to the 1st-order equation and the exponentiation.
Obtain this session's project file.(Save the project file before open)
1.1 Flow Velocity and Pressure Loss Data
To acquire the coefficients, flow velocity [m/s], pressure loss [Pa], and the thickness [m] of porous medium are required.
There are two methods for acquiring them.
・Acquire through experiments
・Acquire through unit model analysis
How to acquire the coefficients through the unit model analysis is explained as below.
1.2 Example of Unit Model Analysis
Evaluate a plate with many holes as porous medium.
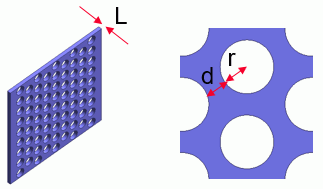
The dimensions and arrangement of the plate and holes are as follows.
Hole radius: r= 2.5 [mm]
Hole arrangement: in regular hexagon
Hole interval: d = 2 [mm]
Thickness of the plate: L = 2 [mm]
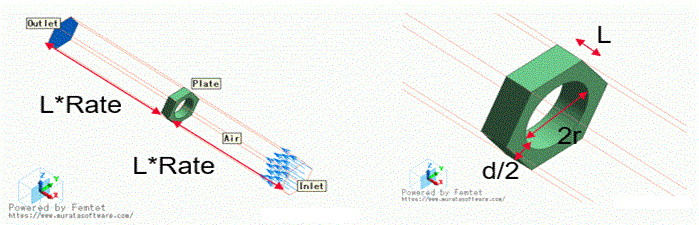
To acquire the pressure loss after the fluid flows through the holes, create an unit model.
The ratio of the length of fluid domain to the thickness is represented as Rate.
As small fluid domain (Rate) may fluctuate pressure loss, the fluid domain is required to be large enough.
A model is created with Rate of 30.
The slip wall outer boundary condition is applied for unit model analysis.
1.3 Flow Velocity-Pressure Loss Data by Parametric Analysis
Flow velocity is defined as a variable u for parametric analysis.
The setting on parametric analysis is as follows.
See Parametric Analysis for more information.
Sweep Setting
Variable Name: u
Type: Linear Step by Step Value
Start Value: 1
Stop Value: 10
Step: 1
Output Setting
Type: Calculated Values
Solver: Fluid solver
Modes: 0: Steady-state Analysis
Value to output: Pressure Loss [Pa]
Boundary Condition: Inlet, Outlet
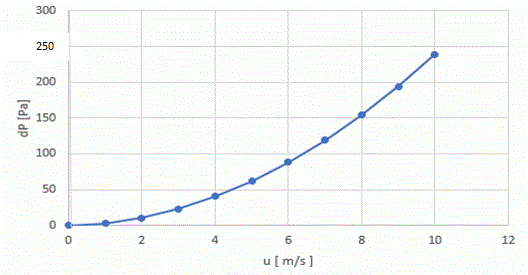
The parametric analysis will give the relationship of flow velocity and pressure loss as below.
1.4 Calculation by Excel
The slope of the [flow velocity-pressure loss] curve given in 1.3 gets steeper.
Assuming that pressure loss is expressed by the 2nd-order equation of flow velocity, the coefficients of the 2nd-order equation are given.
The calculation method by Excel is shown below.
・As the coefficients of 2nd-order equation represents the relationship of flow velocity and pressure loss per unit length, the pressure loss is converted to dP/dL by dividing with the plate thickness L (2 x 10^-3 [m]).
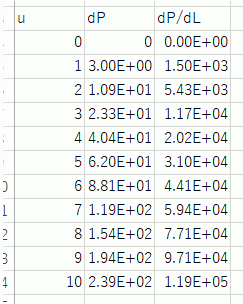
・Create a graph of flow velocity and pressure loss per unit length and show an approximated curve.
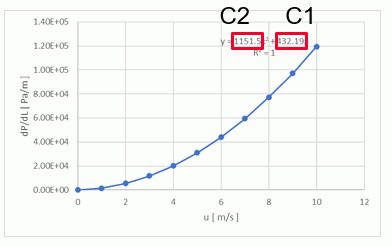
The setting of approximation expression of Excel is as follows.
Polynomial: Order: 2
Select [Set Intercept]
Select [Display Equation on chart]
Select [Display R-squared value on chart]
・The coefficients are given by the formula shown on the approximation curve.
2nd-order coefficient C2 is presented by the coefficient of x^2 (1151.5) and 1st-order coefficient of C1 is presented by the coefficient of x (431.19).
1.5 Verification
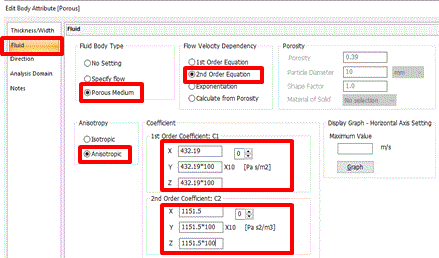
Prepare a simple plate model. Calculated C1 and C2 are set on the fluid dialog box of [Edit Body Attribute] and the model is analyzed.
A full model of the plate having holes is analyzed for comparison.
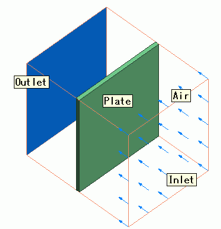
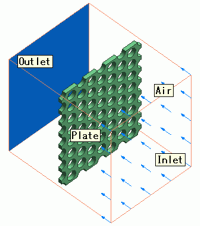
The plate with many holes has flow velocity only in thickness direction and has no flow velocity in other directions.
Large values are set except in thickness direction. Those values are 100 times the one in thickness direction.
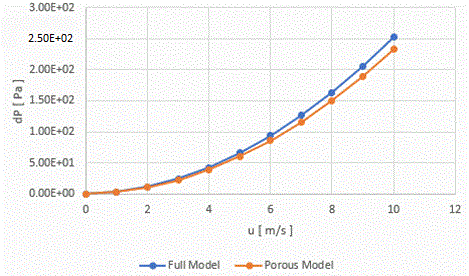
Comparison of the results is shown below.
It is confirmed that the pressure loss of the porous model is close to that of the full model.