


|
Home / Technical Notes / Stress Analysis / Analysis of Nonlinear Materials / Viscoelasticity (Simple Setting)
Viscoelasticity (Simple Setting)
(Note) The viscoelastic analysis is available in an optional package.
By simply setting the temperature dependency of Young's modulus, Femtet can estimate the viscoelasticity automatically for analysis.
Temperature dependency can be set on the [Elasticity tab].
Results with higher accuracy might be obtained than the elastic analysis.
Data Required for Viscoelastic Material Analysis
Prony series and shift function are required to analyze the temperature-dependent viscoelastic materials. Refer to [Analysis of Viscoelastic Materials]for details.
To obtain the data, dynamic mechanical analysis is useful to measure the frequency and temperature dependency of the storage and loss moduli.
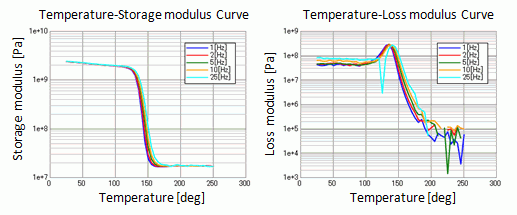
Below is the data of high polymer material measured by the dynamic mechanical analysis. The horizontal axis is temperature.
See Viscoelast_Mat.csv for detail.
With these data, Prony series and shift function will be obtained as shown in [Converting the Measurement Data of Viscoelastic Materials].
A characteristic of high polymer material is that its storage modulus changes drastically and loss modulus becomes maximum at certain temperature.
Such temperature is called glass transition temperature (Tg). In the data above, glass transition temperature is 140°C.
Glass transition temperature shifts to the higher side as the measuring frequency goes higher.
But its shifting amount is small. Frequency dependency is not large.
Simple Setting
- The material is high polymer material having glass transition temperature (Tg). Tg determines the shift function.
- Change of measuring frequency has small impact on the temperature dependency.
With assumptions mentioned above, and from the information of glass transition temperature (Tg) and temperature dependency of Young's modulus (storage modulus),
shift function and Prony series are created automatically.
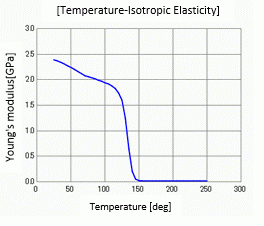
The following explanation is based on the glass transition temperature (Tg) of 140°C and the data having temperature-dependent Young's modulus shown below.
This data is extracted from the result of the storage modulus at 1Hz in the dynamic mechanical analysis shown above.
See SimpleViscoelast_Mat.csv for detail.
How to Create Shift Factor
For high polymer materials, the shift function in the region higher than the glass transition temperature (Tg)
is expressed by the WLF equation as follows
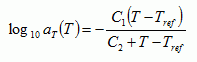
where C1 and C2: Coefficients, Tref: Reference temperature, T: Temperature
It is generally known that C1 is17.44 and C2 is 51.6 if the reference temperature (Tref) is set equal to Tg.
Behavior below glass transition temperature (Tg) with C1 = 17.44 and C2 = 51.6
would diverge at T= Tg-51.6, but not in actuality.
To avoid divergence in the region below glass transition temperature, set C1=26.9691 and C2=79.7938 which will give 0 with T=Tg and 15 with T=Tg-100°C in the equation.
With glass transition temperature (Tg) and coefficients, the shift function is created as follows
|
Coefficient |
Above glass transition temperature (Tg) |
Below glass transition temperature (Tg) |
|
C1 |
17.44 |
-26.9691 |
|
C2 |
51.6 |
-79.7938 |
|
Tref |
Input value for Tg |
Input value for Tg |
The diagram below is an example of the shift function with Tg=140°C.
The measured data and the calculation with the specified coefficients are plotted.
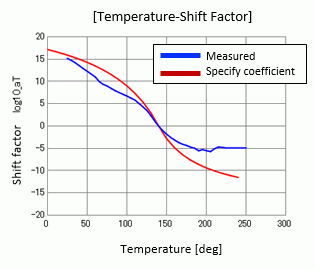
They do not perfectly match over the temperature, but they match well around Tg.
How to Create Prony Series
Master curve frequency dependency is required to create Prony series.
Temperature is converted to frequency with the following equation
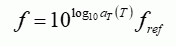
where log10aT(T) is shift function, fref is measuring frequency, f is frequency, and T is temperature.
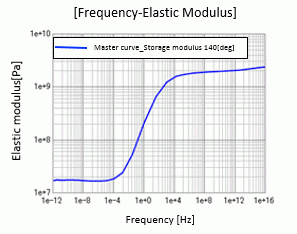
From the data of temperature-dependent Young's modulus, master curve of storage modulus at the glass transition temperature (Tg) is created.
Based on the assumption that "change of measuring frequency has small impact on the temperature dependency",
the measuring frequency is set to1Hz.
If it is known, the measuring frequency can be set.
Diagrams below is the example of converted frequency response for the material having glass transition temperature (Tg) of 140°C.
|
⇒ |  |
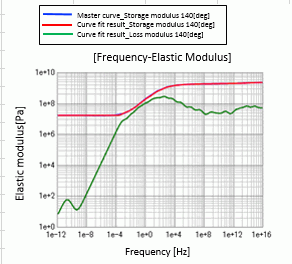
As explained in [Converting Master Curve Frequency Response to Prony Series] of Converting the Measurement Data of Viscoelastic Materials,
Prony series will be obtained based on the master curve of the storage modulus.
An example is shown below.
The master curve based on the temperature dependency of Young's modulus, storage modulus and loss modulus converted with Prony series are plotted.
The master curve and the curves converted with Prony series well match.
Accuracy of Relaxation Factor in the Simple Setting
With viscoelasticity measured accurately with dynamic mechanical analysis and estimated with the simple setting,
relaxation behaviors are plotted with temperature range of 90°C~190°C at the time of 0.01s, 1.0s, and 100s.
| 0.01 [s] | 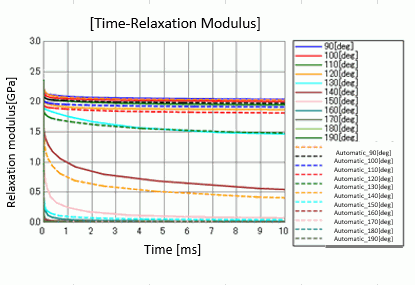 |
| 1 [s] | 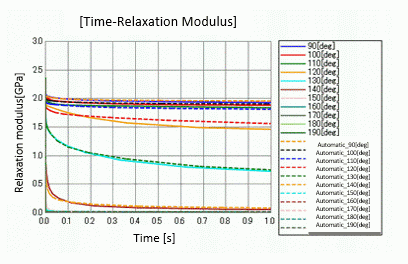 |
| 100 [s] | 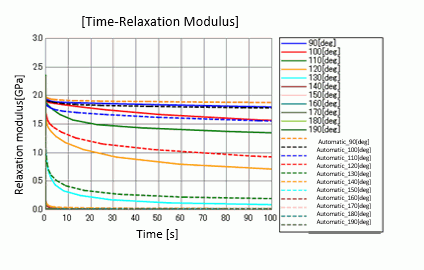 |
General tendency is that stress relaxation above the glass transition temperature (Tg) occurs place drastically in a short time.
Stress relaxation below the glass transition temperature (Tg) is almost negligible and stays constant.
This nature is well reproduced with the simple setting.
In terms of the accurate reproduction of the relaxation behavior, it can be said as follows.
At 1s, it is well reproduced at all temperatures.
In the regions where the temperature is higher than the glass transition temperature (Tg) and time is short, and
where the temperature is lower than the glass transition temperature (Tg) and time is long,
simple setting gives different results.
This comes from inaccurate reproduction of the shift function.
Example of Simple Setting
In [Example 60: Warp of Substrate in the Cooling Process of Resin], analyses are compared between viscoelasticity setting and simple setting.
Warping amount of the substrate is almost same between two analyses.
The simple setting can give high accuracy to the analysis where the temperature is decreased crossing the glass transition temperature.
It is owing to the nature of the high polymer materials that "stress relaxation above the glass transition temperature (Tg) occurs drastically in a short time whereas it is almost negligible and stays constant below the glass transition temperature (Tg)" which is well reproduced by the simple setting.