|
Home / Show Results / Result Field / Isoline Contour
Isoline Contour
On the [Results] tab, go to
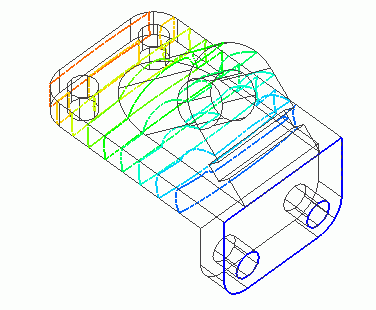
click the [Isoline Contour] ![]() . The field will show up with the contour of isolines based on the field values.
. The field will show up with the contour of isolines based on the field values.
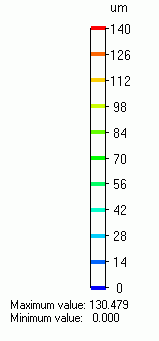
The color scale indicates the colors associated with field values.
The isoline contour gives the clearer image of the field change than the gradation contour
in which the colors change progressively and the field appears "too much continuous". It is best suited to show the magnetic field lines in the 2D magnetic analysis.
Isoline Contour Color Scale
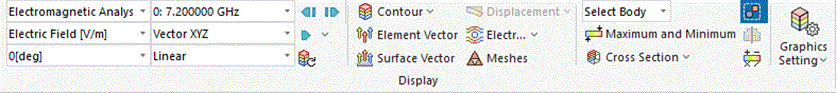
Results to Display
In the selection box below, select the Field Type, Component, Phase, and Scale.

Display Setting
|
|
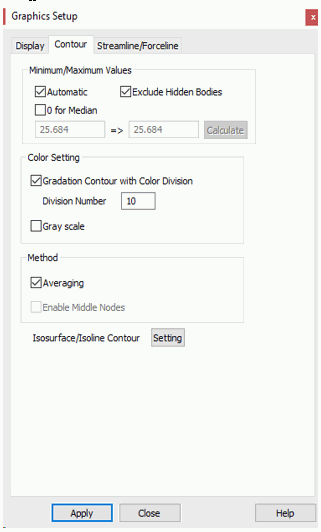
Click [Graphics Setup] will show up. [Contour] tab is for the setting of contour display. Minimum/Maximum ValuesThe minimum value is blue and the maximum value is red. The values in between will have the color progressing from blue to red. The minimum/maximum values can be changed to suit your requirement. Number of DivisionsThe default is 10. It can be changed at Division Setting.
Further details are explained at each dialog's Help. |