


|
Home / Examples / Stress Analysis [Galileo] / Example 16: Harmonic Analysis of Standing Bars
Example 16: Harmonic Analysis of Standing Bars
General
-
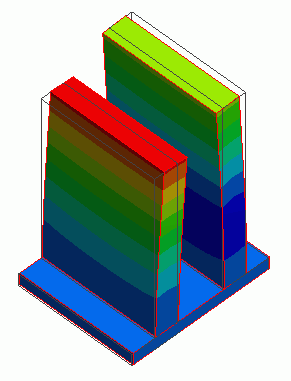
Forced oscillation is applied on two standing bars with different heights. The frequency of the forced oscillation affects the vibration.
-
The resulting vibrations are analyzed.
-
Refer to Example 75: Transient Analysis of Standing Bars for the result of the transient analysis.
-
Unless specified in the list below, the default conditions will be applied.
-
The oscillation amplitude near the resonant frequency depends on the mechanical loss. Adjust the mechanical loss if needed. (See Example 50)
-
Obtain this session's project file. (Right-click and choose 'Save link as')
-
Results will vary depending on Femtet version and the PC environment.
Analysis Space
|
Item |
Settings |
|
Analysis Space |
3D |
|
Model Unit |
mm |
Analysis Conditions
The analysis type is harmonic analysis.
|
Item |
Settings |
|
Solver |
Stress Analysis [Galileo] |
|
Analysis Type |
Harmonic Analysis |
|
Options |
N/A |
The resonant frequencies of the respective towers are 1250 Hz and 1650 Hz, which are acquired through individual analyses.
Therefore, the sweep range is around those frequencies.
The harmonic analysis is set as follows.
|
Tab |
Setting Item |
Settings |
|
Harmonic analysis |
Frequency |
Minimum: 1000 [Hz] Maximum: 2000 [Hz] |
|
Sweep Type |
Linear Step by Number of Divisions: Number of Divisions 20 |
Model
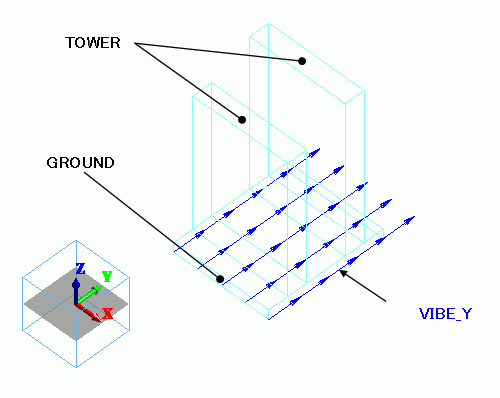
Two bars (TOWER) are standing on a plate (GROUND).
As a boundary condition, the displacement boundary condition (VIBE_Y) is set to the face topology
of the bottom face of GROUND to force the displacement in the Y direction.
Body Attributes and Materials
|
Body Number/Type |
Body Attribute Name |
Material Name |
|
0/Solid |
TOWER |
001_Al * |
|
1/Solid |
TOWER |
001_Al * |
|
2/Solid |
GROUND |
001_Al * |
* Available from the material DB
Boundary Conditions
To make the forced vibration, the displacement is set on the bottom face
of GROUND in the Y direction and the displacement in X and Z directions are fixed.
|
Boundary Condition Name/Topology |
Tab |
Boundary Condition Type |
Settings |
|
VIBE_Y/Face |
Mechanical |
Displacement |
Select all X/Y/Z components. UX=UX=0.0, UY=1×10⁻³ [m] |
This means the magnitude of Y displacement is 1[mm].
Results
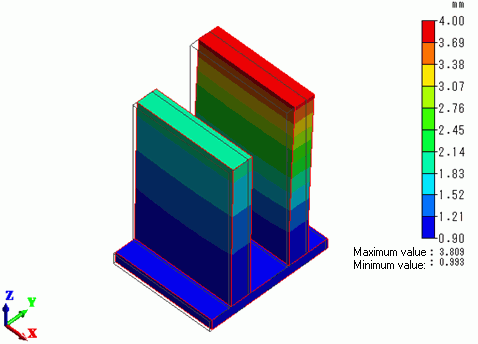
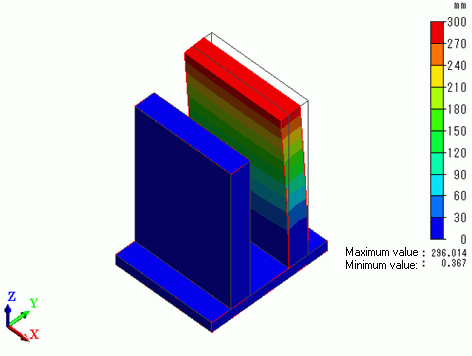
The displacement diagrams are shown below. The oscillation frequencies are 1000 [Hz], 1250 [Hz], 1450 [Hz], 1600 [Hz], and 2000 [Hz], respectively.
The contour diagram shows the magnitude of displacement.
1000 [Hz]
1250 [Hz]
1450 [Hz]
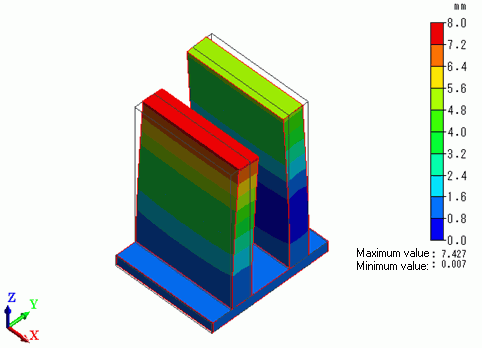
1600 [Hz]
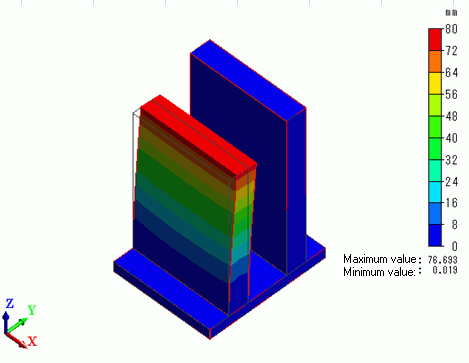
2000 [Hz]
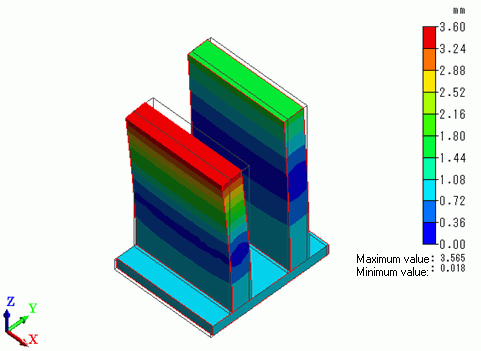
The displacement is high at the resonant frequencies: 1250 [Hz] and 1600 [Hz]. (Watch out for the maximum value of color scales)
The phases of each tower at the intermediate frequency between the two resonant frequencies are inversely related.