


|
Home / Examples / Piezoelectric Analysis [Rayleigh] / Example 12: Acoustic Impedance
Example 12: Acoustic Impedance
General
-
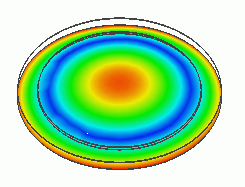
Acoustic impedance is set in the model of Example 2 to take into account the air resistance.
The effect of the acoustic impedance is examined.
-
Obtain this session's project file. (Right-click and choose 'Save link as')
-
Results will vary depending on Femtet version and the PC environment.
Analysis Space
|
Item |
Settings |
|
Analysis Space |
3D |
|
Model Unit |
mm |
Analysis Conditions
|
Item |
Settings |
|
Solver |
Piezoelectric Analysis [Rayleigh] |
|
Analysis Type |
Harmonic Analysis |
|
Options |
N/A |
|
Output Setting |
Select [Impedance] |
The harmonic analysis tab is set up as follows.
|
Tab |
Setting Item |
Settings |
|
Harmonic analysis |
Frequency |
Minimum: 4.75×10³ [Hz] Maximum: 4.90×10³ [Hz] |
|
Sweep Type |
Select [Linear Step by Division Number]. Number of Divisions: 50 |
Model, Body Attributes and Materials - same as the example 2
Boundary Conditions
|
Boundary Condition Name/Topology |
Tab |
Boundary Condition Type |
Settings |
|
Outer Boundary Condition |
Mechanical |
50 [Pa*s/m] |
|
|
earth/Face |
Electric |
Electric Wall |
Electric Potential Specified: Electric Potential 0 [V] |
|
earth/Face |
Mechanical |
Acoustic Impedance |
50 [Pa*s/m] |
|
hot/Face |
Electric |
Electric Wall |
Electric Potential Specified: Electric Potential 1 [V] |
|
hot/Face |
Mechanical |
Acoustic Impedance |
50 [Pa*s/m] |
All boundary conditions are set with the acoustic impedance so that the acoustic impedance is set around the model entirely.
In the project file, the values of acoustic impedance are all set at 50 [Pa・s/m] for the model, [12_Harmonic analysis_50].
For the model, [12_Harmonic analysis_409], the values of acoustic impedance are all set at 409 [Pa・s/m].
For the model, [12_Harmonic analysis_0], the values of acoustic impedance are all set at 0 [Pa・s/m].
Results
The frequency responses of impedance obtained by the analysis with three acoustic impedances are compared. As the acoustic impedance becomes larger, the response at the resonant point becomes smoother.
Graph legends and corresponding acoustic impedances are as follows.
[12_Harmonic analysis_50.s1p]: 50 [Pa・s/m]
[12_Harmonic analysis_409.s1p]: 409 [Pa・s/m]
[12_Harmonic analysis_0.s1p]: 0 [Pa・s/m]
409 [Pa・s/m] is the specific acoustic impedance of air.
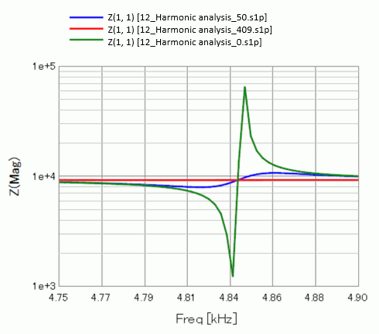
- The frequency response of impedance can be plotted from an S(Y) parameters graph.
- To add impedance characteristics on the same graph, drag and drop the file with extension s1p from a result folder.