


|
Home / Show Results / Displayable Results for Each Analysis / How to Examine the Ports of Electromagnetic Analysis
How to Examine the Ports of Electromagnetic Analysis
In the 3D electromagnetic analysis (harmonic or transient analysis), before executing 3D analysis,
2D waveguide is calculated on the boundary of port to determine the propagation modes. If the selected mode is not what you intended,
the 3D analysis will not result in what you expect.
Explained below are how to examine the waveguide analysis results, how to select propagation mode, and the details of the port index of S-parameters.
1. How to Examine the Waveguide Analysis Results
1-1. How to Examine the Results of Field
After finishing electromagnetic analysis, set [Analysis Type] to Port on the [Results] tab as shown in Fig. 1.
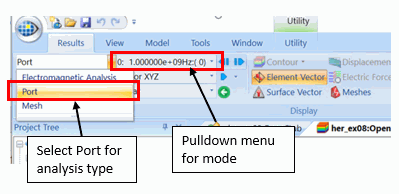
Fig. 1: Electromagnetic Fields at Ports
From a pull-down menu of [Mode], a frequency and its mode number are selectable.
Click [Element Vector]  to display the element of the port as in Fig. 1.
1-2. How to Check the Propagation Constants and Mode Numbers
Go to [Results] tab > [Show Results]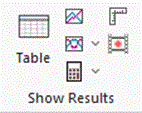 > [Chart] > [Mode Information] to show the dialog box of propagation constant.
In the dialog box, port name, port number p* propagation mode number m*, phase constant, and attenuation constant
are shown.
Fig. 2: Dialog Box of Propagation Constant (Left: modes used for electromagnetic analysis, Right: modes not used for electromagnetic analysis)
For the electromagnetic analysis, the propagation modes are selected from modes obtained in the waveguide analysis.
The left figure of Fig. 2 is a dialog box of propagation constant of the propagation modes used for electromagnetic analysis. p1m means the 1st propagation mode of the 1st port.
p2m means the 1st propagation mode of the 2nd port.
The right figure of Fig. 2 is a dialog box of propagation constant of the propagation modes that are not used for electromagnetic analysis.
The modes that were obtained by the waveguide analysis but not used in the electromagnetic analysis are indicated by [Not used].
-
The port numbers are automatically assigned to the ports starting from 1.
The numbers will be assigned automatically in the incremental order of the boundary condition names of the ports.
They are displayed as "P1, P2, ..." on the model as shown in Fig. 3.
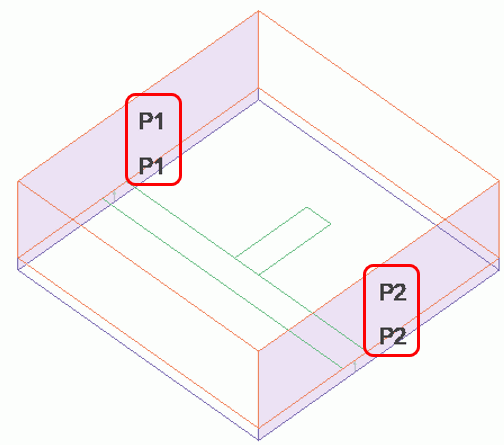
Fig. 3: Port Numbers on the Model
-
The propagation mode numbers are assigned to the modes used in the electromagnetic analysis starting from 1.
If multiple modes are used at the port number 1, the dialog box of propagation constant will display like
"p1m1, p1m2, ...".
2. How to Select Propagation Mode
For the electromagnetic analysis, the propagation modes are selected from the modes that were obtained in the waveguide analysis.
Here is how to select propagation modes.
2-1. How to Check the Modes Obtained in the Waveguide Analysis
The modes obtained in the waveguide analysis can be viewed from the results of port. As shown in Fig. 4, the modes are selectable from
the pull-down menu.
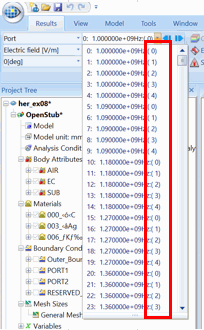
Fig. 4: Mode Number for Each Frequency
Fig. 4 shows an example where 5 modes are obtained in the waveguide analysis. There are modes (0) through (4) for each frequency.
The mode numbers starting from 0 are assigned to the phase constants regardless of whether they are used for the electromagnetic analysis. The phase constants are arranged in a descending order.
-
The number of modes to obtain in the waveguide analysis can be set at [Number of modes to precalculate] in the [Port Setting].
2-2. How to Determine Modes for Use in the Electromagnetic Analysis
The propagation modes for the electromagnetic analysis are determined by the maximum frequency.
Fig. 5 shows an example of three propagation modes.
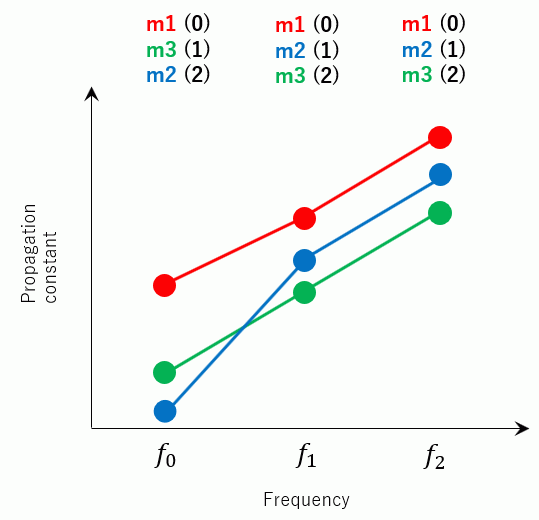
Fig. 5: Propagation constant of Propagation Mode
The propagation mode number is determined by the maximum frequency f2 . The propagation mode numbers are assigned in the descending order
of the phase constants as m1, m2, m3. In the waveguide analysis, the mode numbers are assigned as 0, 1, 2, and so on.
-
If five modes are obtained in the waveguide analysis, the mode numbers are 0, 1, 2, 3, and 4.
In this example, only three modes are used. The rest of them is not used as indicated [Not used] in the right figure of Fig. 2.
The propagation mode numbers are not assigned to them.
In the dialog box of propagation constant, m1, m2, and m3 are used to represent the propagation constants. The pull-down menu of mode shows
the numbers 0, 1, and 2 that are set in the waveguide analysis (Fig. 4).
For the frequencies other than the maximum frequency, the assigned modes have the electric fields similar to the propagation mode determined by the maximum frequency.
m1, m2, and m3 in Fig. 5 are the propagation mode numbers.
The numbers 0, 1, and 2 in the parentheses are the mode numbers set in the waveguide analysis.
In Fig. 5, at the frequency f1 the mode number 0 that is given by the waveguide analysis has the electric field similar to the propagation mode m1.
The propagation mode number m1 is assigned at f1 . Likewise, the mode number 1 and mode number 2 are given
propagation mode numbers m2 and m3 respectively.
In Fig. 5, at the frequency f0, the mode number 0 is given the propagation mode number m1.
Since the mode number 1 has the electric field similar to the propagation mode number m3 at the maximum frequency f2, the propagation mode m3 is set to the mode number 1.
The propagation mode number m2 is assigned to the mode number 2.
As described above, the correspondence of the mode numbers set in the waveguide analysis and the propagation mode numbers (m1, m2, m3) is changed according to the frequency in some cases.
To ensure that a proper propagation constant is selected, see the dialog box of propagation constant of the waveguide analysis
and check if a propagation mode number is assigned to the right mode.
3. Port Index of S-parameters
Port index corresponds to i or j in the matrix S(i, j ) that represents the S-parameters. It is determined by the port number and propagation mode number.
The mode number set in the waveguide analysis and the propagation mode number set in the electromagnetic analysis are set for each port.
The propagation mode number and the port number must be used in one set.
On the other hand, the port index is the sequential number assigned to all propagation modes used in the model.
Therefore, a port index represents a single propagation mode at a specific port.
The port index can be seen either in the log file or at the Port index in the [SYZ matrix] dialog box.
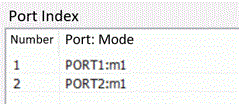
Fig.6: Port Index
In this figure, [i : PortName : mx] indicates that the port index i allocates the xth propagation mode to the port PortName
where x is a propagation mode number used in the 3D analysis.
In the port index below for example,
|
Port Index |
|
i : PortA : mx |
S-parameter S(i, j ) is the ratio of the incident wave of propagation mode number y at PortB and the reflecting or transmitting wave of propagation mode number x at PortA.
If the port index i and j are the same, the wave at PortA is reflecting. If i and j are different, the wave at PortA is transmitting.
-
Refer to [SYZ Matrix] for more details of port index.