


|
Home / Show Results / Descartes, the Graphing Tool
Descartes, the Graphing Tool
Descartes is a graphing tool to show the charts for the results or the nonlinearity table of material properties.
-
An equation can be entered in the series title. See the detail.
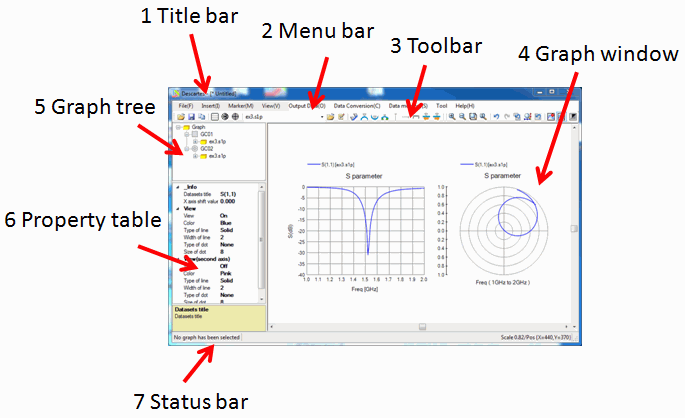
Descartes screen
|
1 |
Shows the application name (Descartes) and the absolute path of the file currently on display.
|
|
|
2 |
Shows the menu of operations. See [Menus] for more information.
|
|
|
3 |
Shows the buttons for the frequently used commands. Please refer to the [Commands on Toolbar] for more information.
|
|
|
4 |
Edits the graph. The graph, graph marker, and input text can be registered.
|
|
|
5 |
Manages graphs, graph data, and graph markers. See [Graph Tree] for more information.
|
|
|
6 |
Edits the settings of selected graph, dataset, and graph marker. See [Graph Properties], [Dataset Properties] and [Marker Properties] for more information.
|
|
|
7 |
Displays messages, mouse cursor coordinates, graping scale etc.
|