|
Home / Show Results / Descartes, the Graphing Tool / Property table / Graph Properties
Graph Properties
When a graph is selected, its properties are shown on property table. The graph properties can be edited on the property table.
Properties of XY graph
|
|
_Info |
Graph ID |
Identifies the graph.
|
|
Graph Type |
Specifies XYGraph, SmithChart, or PolarGraph.
|
||
|
SYZ Parameter Type |
Specifies S_Para, Y_Para, and Z_Para.
|
||
|
Reference Impedance |
Specifies the reference impedance for all ports.
When all the ports do NOT have an identical reference impedance, this field indicates "0 +j0". The values written in the touchstone file are used for the graph.
|
||
|
Data Conversion Type |
Specifies the conversion type. Types are None(no conversion), Q, L, C, Balance, PhaseAmpBalance, K_GMAX, IntegralLoss, and and TDRZ.
|
||
|
|||
|
_X-axis Information / _Y-axis Information / _Y-axis Information (secondary) |
Display Secondary Y-axis scale |
Displays the secondary Y-axis scale on the right of the graph.
|
|
|
Complex Number Format |
Selectable from Mag, Phase, Real, Imag, dB, Log and VSWR
|
||
|
Auto Scale |
Adjusts the scale of the following items.
Min value :the minimum value on the axis Max value :the maximum value on the axis Axis Scale Step :the width of the division Number of Axis Scale Divisions :Number of Divisions The automatic calculation is executed if [Logarithm] is selected.
|
||
|
Logarithm |
Switches ON/OFF the logarithm display.
|
||
|
Format |
Specifies the format of the numeric values on the axis.
Auto: Sets the format automatically Full: 1000000 for example Scientific: 1e6 for example Engineering: 1M for example
|
||
|
Number of Decimal Places |
Sets the number of decimal places. This setting will show up when the display format is other than "Auto".
|
||
|
Data min value |
Shows the he minimum value in the data.
|
||
|
Data max value |
Shows the maximum value in the data.
|
||
|
Title |
Graph Title |
Specifies the graph title (text shown above the graph).
|
|
|
Graph title font |
Specifies the font of the graph title
|
||
|
X-axis Title |
Specifies the X-axis title (text shown below the x-axis).
|
||
|
X-axis Font |
Specifies the font of the x-axis title.
|
||
|
X-axis scale font |
Specifies the font of the numeric values on the x-axis.
|
||
|
Y-axis Title |
Specifies the Y-axis title (text shown by the y-axis).
|
||
|
Y-axis Font |
Specifies the font of the y-axis title.
|
||
|
Y-axis scale font |
Specifies the font of the numeric values on the y-axis.
|
||
|
Secondary Y-axis Title |
Specifies the secondary Y-axis title (text shown by the secondary y-axis).
|
||
|
Secondary Y-axis Title Font |
Specifies the font of the secondary y-axis title.
|
||
|
Secondary Y-axis scale font |
Specifies the font of the numeric values on the secondary y-axis.
|
||
|
Display |
Display Spline |
On: smooth line / Off: polygonal line
|
|
|
Display Legend |
On: Show legend / Off: Hide legend
|
||
|
Display Filename |
On: Show file name on legend / Off: Hide filename on legend
|
||

Properties of Smith Chart
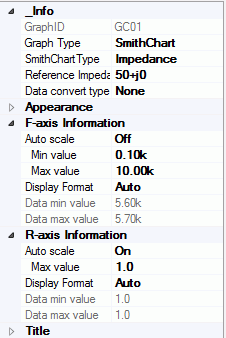
The settings for smith chart are similar to the settings for XY graph, stated above. The different settings are as follows. For the same settings, see Properties of XY graph above.
|
|
_Info |
SmithChartType |
Switches Impedance chart, admittance chart and immittance chart.
|
|
F-axis Information / R-axis Infromation |
The range of frequency / The range of reflectance ratio |
||
Properties of Polar Graph
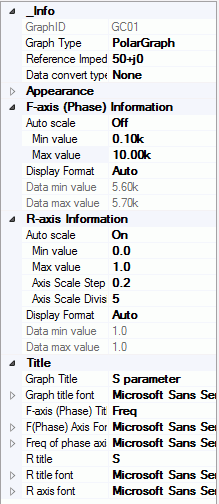
The settings for polar graph are similar to the settings for XY graph, stated above. The different settings are as follows. For the same settings, see Properties of XY graph above.
|
|
F-axis Information / R-axis Information |
The range of frequency / The range of reflectance ratio |