


|
Home / Show Results / Characteristics by Charts / Impedance (Piezo-Resonance)
Impedance (Piezo-Resonance)
On the [Results] tab, go to  , click ▼ at the side of [Chart]
 ![]() .
.
Select [Impedance (piezo-resonance)] on the submenu.
- This function is available for one-port model only. One-port model has an electric wall of 0[V] and boundary condition specified with electric potential, an electric wall of non-zero[V] and boundary condition specified with electric potential. The type of non-zero[V] electric wall and boundary condition specified with electric potential is only one.
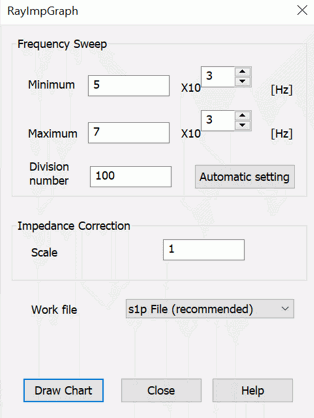
The [RayImpGraph] dialog box will show up. Enter the maximum and minimum values of the frequency and number of divisions, and press a draw chart button.
The graph is either impedance or admittance. The choice is made on the piezoelectric analysis tab for analysis condition.
You can also change the choice after drawing.
Select Y_Para (admittance) or Z_Para (impedance) for SYZ parameter type in the graph properties.
However, if the work file format is plt, the conversion is not possible.
The approximation of impedance or admittance is calculated from the eigenvectors acquired from the piezoelectric-resonant analysis.
|
Item |
Notes |
|
Frequency Sweep |
Minimum: The minimum frequency of the sweep [Hz] Maximum: The maximum frequency of the sweep [Hz] Number of Divisions: The number to divide the sweep Automatic Setting: The minimum and maximum frequencies for sweep are set as follows. Maximum = Maximum resonant frequency x 1.2
The plotting points are the number of divisions + 1.
|
|
Impedance Correction |
Specifies the constant to multiply the impedance value or the admittance value. For example, enter 0.5 to multiply or divide for a half model.
|
|
Work file format |
Sets the file format for graphing. s1p file (recommended): a touchstone file for one-port model. Various graphing functions available such as conversion between admittance and impedance. plt file: a conventional format.
|