


|
Home / User Interface
User Interface
Femtet user interface consists of the main window, menus and trees.
There are two types of main window:
-
Modeling window
Displays the model.
-
Results window
Displays the results such as fields, charts and tables.
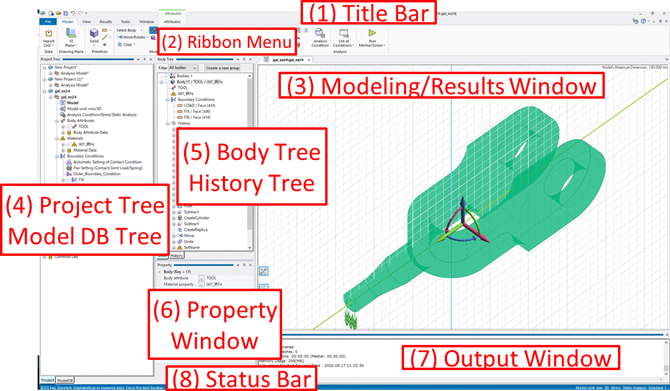
Below is the overview of user interface.
|
1 |
Title bar |
Displays currently active document name. There are cases when [- Limited History] is added at the end of the document name. "*" is added at the end of the document name if the model is not saved yet. |
|
2 |
Ribbon menu |
Provides various menus and command buttons. The are grouped by functional category. |
|
3 |
Modeling/Results window |
Displays either the model or the results. |
|
4 |
Project tree Model DB tree |
Displays the various information related to the model and the bodies. |
|
5 |
Body tree History tree |
|
|
6 |
Property window |
Shows up when bodies or topologies are selected. The attributes of bodies and topologies can be modified on this window, See [Property] for the detail. |
|
7 |
Output window |
Displays the calculation status, messages, etc |
|
8 |
Status bar |
Displays current commands, conditions, actions etc. |
-
They can be shown or hidden by switching at [Subwindow] on [View] tab.
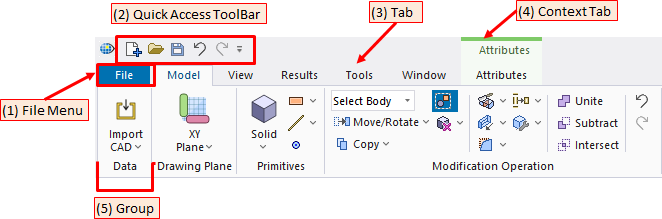
Ribbon Menus
|
1 |
File Menu |
File menu including filing commands is accessible through this button. See [File Menu] for more information. |
|
2 |
Quick access toolbar |
The quick access toolbar is a customizable toolbar that exposes frequently used commands. |
|
3 |
Tab |
Shows groups of related commands. |
|
4 |
Context tab |
Appears when specific objects are selected. |
|
5 |
Group |
Labeled command sets of similar functions. |
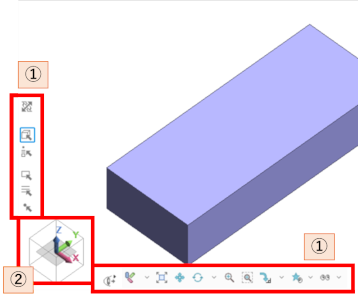
Modeling / Results window
|
Modeling window |
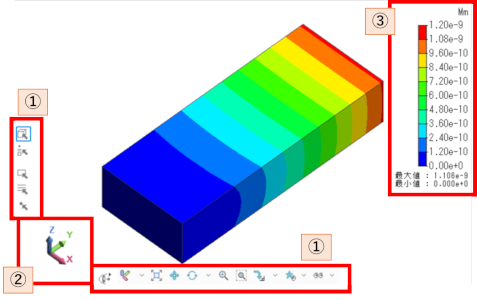
Results window |
|
|
|
|
1 |
Tool panel |
Provides functions for viewpoint operation and selection change. See [Tool Panel Operations] for more information. |
|
2 |
Coordinate axes |
Shows the current viewpoint visually. By clicking the axes, the viewpoint and the drawing plane can be changed. See [Coordinate Axes Operations] for more information. |
|
3 |
Color Scale |
Shows the values of the results and the maximum and minimum values by corresponding colors. See [Color Scale] for more information. |