|
Home / Show Results / Calculating Field Values
Calculating Field Values
To show the gradation contour or the results at specified coordinates, field values need to be calculated the specific locations.
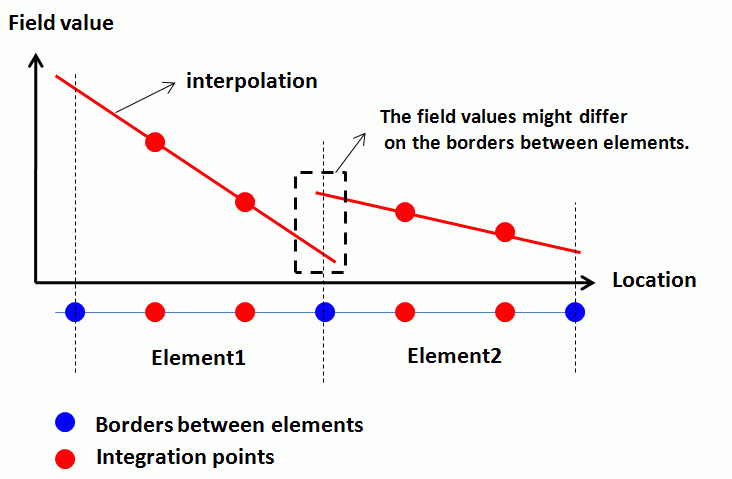
The integration points, where the governing equations are solved, are discretely located inside the elements, so the field values at the specified points are obtained by interpolating the values at integration points.
The interpolation is performed for each individual element.
As a result, the field values might differ on the borders between elements.
This mismatch would be minimized by decreasing the mesh size.
Another method to solve this problem is to average the mismatched filed values. [Graphics Setup] > Contour tab > Method > Select [Averaging]. When the bordering elements are of the same material, the averaged field values will be output with this method.
-
The averaging will not be performed when the bordering elements are of different materials as it is common that the field values differ on the borders between different elements.
The table below summarizes how the interpolation is applied in various cases.
-
If the averaging is disabled, you cannot specify the elements so the values might be inconsistent each time they are output.
Right Click > [Output Node Results by CSV] outputs the field values of all the elements.
-
When the mouse pointer is rested on a node bordering different materials, the tooltip will indicate the field value of either element (material). Pressing the space key will switch the elements.
-
[Show Maximum/Minimum] calculates the field values of all the elemental nodes and outputs the maximum/minimum values.
If [Averaging] is selected, however, field values larger than the maximum value or smaller than the minimum value might exist inside the elements
-
The color contour diagram is displayed based on the nodal field values. The non-nodal field values are obtained by interpolating the nodal values.
Therefore, they might differ from the values calculated for specific coordinates or graphing.
|
Locations |
Averaging |
Applicable elements |
How the interpolation is applied |
|
Inside the elements |
Don't matter |
Elements accommodating the specified coordinates |
Interpolation is done inside each applicable element.
|
|
Elemental nodes or border points bordering elements of same materials |
On |
All elements pertaining to the border |
Interpolation is done inside each applicable element. The results at each point are averaged.
|
|
Elemental nodes or border points bordering elements of different materials |
Interpolation is done inside each applicable element. The results at each different material point are averaged.
|
||
|
Elemental nodes or border points bordering elements of same materials |
Off |
One element pertaining to the border |
Interpolation is done only inside the applicable element.
|
|
Elemental nodes or border points bordering elements of different materials |
One element for each material pertaining to the border |
Interpolation is done only inside the applicable element.
As many field values as the number of pertaining materials will be output.
|
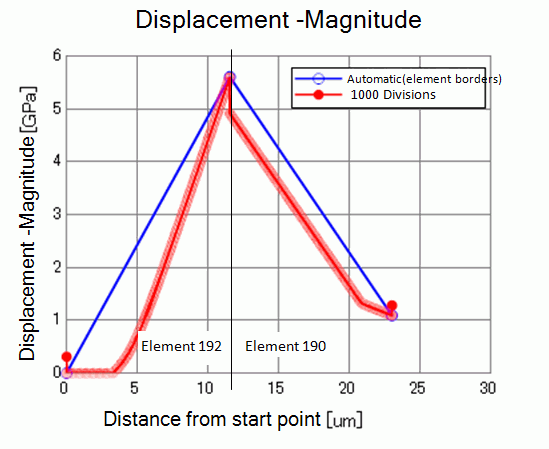
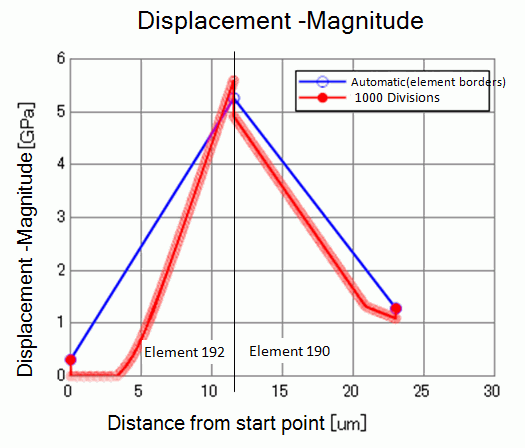
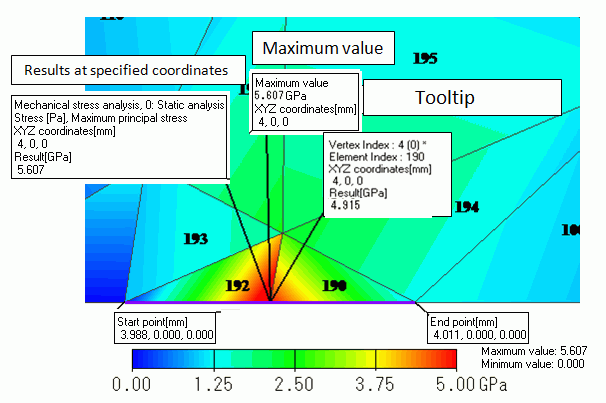
The effect of averaging is studied for Example 34: Energy Release Rate by examining the stress at the tip of the crack located at (4, 0, 0).
The interpolated values of stress don't match around the tip where the stress changes drastically.
If [Averaging] is selected, [Show Maximum/Minimum], [Results at Specific Coordinates], and [Tooltip] all indicate the same value for the node at (4, 0, 0)
bordering Element 192 and Element 190.

The graph below shows two plots for the maximum principle stress in the proximity of the node: one is with the number of divisions set to 1000 between startpoint and endpoint and the other is set with automatic division.
The former is discontinuous
while the latter is continuous.
Thus the discontinuity might be observed when the field is graphed. The contour diagram is always continuous as it is based on the averaging.
If [Averaging] is deselected, [Show Maximum/Minimum], [Results at Specific Coordinates], and [Tooltip] don't indicate the same value.
[Results at Specific Coordinates] indicates 5.607GPa which is the value for Element 192. [Tooltip] indicates 4.915GPa for Element 190.
(It is unpredictable which element is used in the calculation.)
[Show Maximum/Minimum] indicates 5.607GPa as it is larger than 4.915GPa.
The graph below shows two plots for the maximum principle stress near the node: one is with the number of divisions set to 1000 between startpoint and endpoint and the other is set with automatic division.
The former is discontinuous.
The latter is continuous with the value of either element. In this particular example, the value of Element 192 is output.