The calculation results are available in various formats.
Let's take a look at the temperature and flow velocity by gradation contour and at the cross section.
-
Check the calculated values.
The temperature (maximum, minimum, average) and heat balance are shown in the table.
|

|
-
Check the calculated values from the fluid analysis.
Switch from  to to  in the combo box below the table. in the combo box below the table.
The volumetric flow rate and the force on the wall face are summarized on the tables.
|
|
-
We take a look at the gradation contour of the temperature.
On the [Results] tab, go to
 and click [Gradation Contour] and click [Gradation Contour]  . .
The gradation contour diagram of the temperature will show up.
|

The Gradation Contour of Temperature |
|
-
-
To modify the contour display,
on the [Results] tab, go to

and click [Graphics Setup]  . .
In the [Graphics Setup] dialog box, select [Contour] tab,
and modify the maximum/minimum values, the number of divisions, the colors etc.
The Contour tab is explained here |

|
-
|
|
|
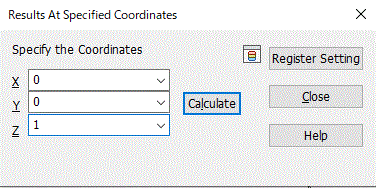
The [Results at Specified Coordinates] dialog box will show up.
Enter the coordinates of your interest and click the [Calculate] button.
See [Results at Specified Coordinates] for more information.
|
|
|
The contour and vector values for the currently chosen field will be shown on .
|
|
-
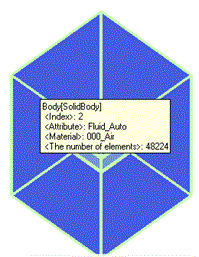
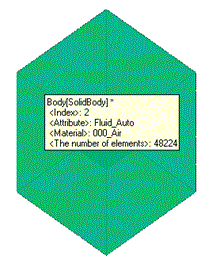
Next, hide the fields of the air body so that the temperature of the solid body can be displayed.
Highlight the air body on the modeling window and click to select.
|
|
-
Right-click to open the menu, and select [Hide Body]  . .
|
 |
|
Only the temperature of the solid will be shown. |
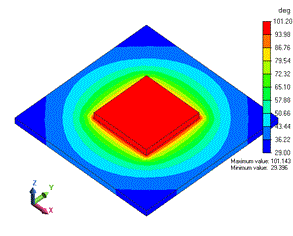
Gradation Contour for Solid Only |
-
Show the results of the fluid analysis.
On the [Results] tab, go to
.
Click the solver combo box  to select to select  . .
|
|
-
Show the hidden air body.
Right-click where there is no model in the modeling window, then select [View] ▶ [Show All Bodies]  on the right-click menu. on the right-click menu.
|
 |
-
Next, show the vectors of the flow velocity.
On the [Results] tab, go to

click [Element Vector]  . .
The vectors of the flow velocity will show up.
|
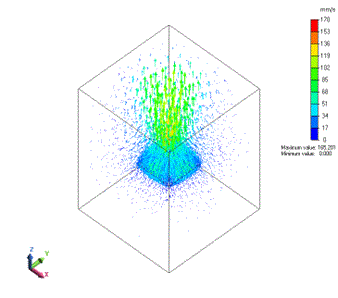
Vectors of Flow Velocity |
-
Let's take a look at the results at the streamlines.
On the [Results] tab, go to

click [Element Vector] to cancel the display of vectors.
Click [Streamlines]  . .
The streamlines will be shown.
|

Streamlines |



 .
.

 .
. Prev Next