Home / Tutorial / Simple Fluid-Thermal Coupled Analysis (Pascal/Watt) / 08.View the Results
08.View the Results
The calculation results are available in various formats.
Let's take a look at the temperature and flow velocity by gradation contour and at the cross section.
Procedure
-
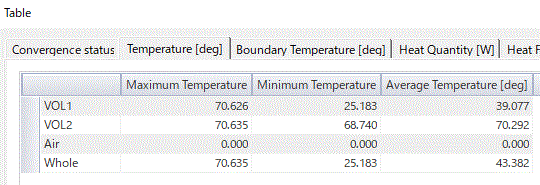
Check the calculated values.
The maximum and minimum temperatures and other results are shown in the table.
|
|
-
We take a look at the gradation contour of the temperature.
On the [Results] tab, go to

and click [Gradation Contour]  . .
The gradation contour diagram of the temperature will show up.
|
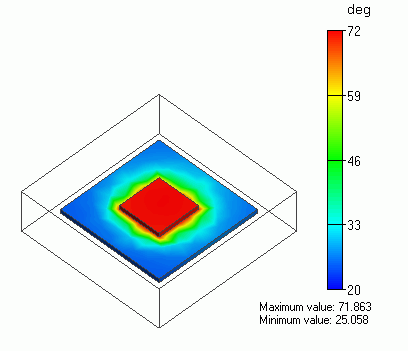
The Gradation Contour of Temperature |
|
-
-
To modify the contour display,
on the [Results] tab, go to

and click [Graphics Setup]  . .
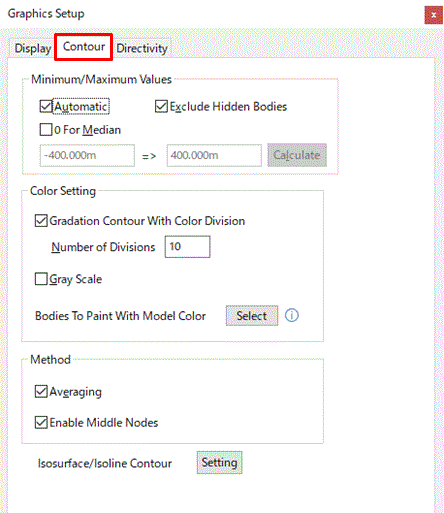
In the [Graphics Setup] dialog box, select [Contour] tab,
and modify the maximum/minimum values, the number of divisions, the colors etc.
The Contour tab is explained here
|
|
-
|
|
|
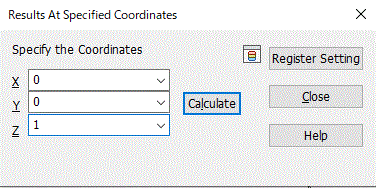
The [Results at Specified Coordinates] dialog box will show up.
Enter the coordinates of your interest and click the [Calculate] button.
See [Results at Specified Coordinates] for more information.
|
|
|
The contour and vector values for the currently chosen field will be shown on .
|
|
-
You can view the vectors of the flow velocity.
On the [Results] tab, go to
,
select [Simple fluid-thermal analysis] at an analysis type  , and select [Flow velocity] at Field Type , and select [Flow velocity] at Field Type  . .
Click [Element Vector]  . .
The vector diagram of the flow velocity will show up.
|
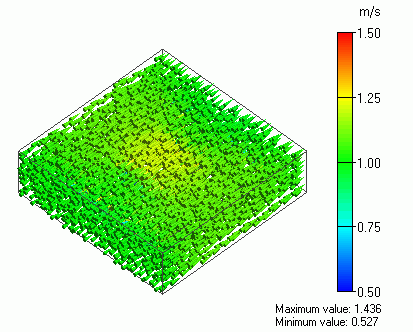
The Vectors of Flow Velocity |
-
Let's take a look at the cross section.
On the [Results] tab, go to

and click [Show Cross Section]  . .
The [Cross Section] dialog box will show up.
|
|
-
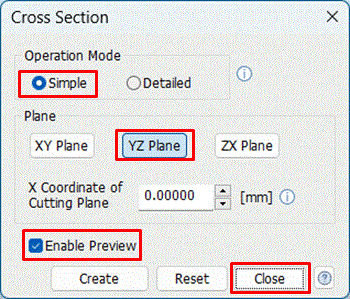
In the [Cross Section] dialog box, select Simple Mode.
Select [Enable Preview] and
click [YZ plane].
Click [Close].
|
|
|
The cross section will show up.
Click  on the [Cross Section] dialog and exit. on the [Cross Section] dialog and exit.
|
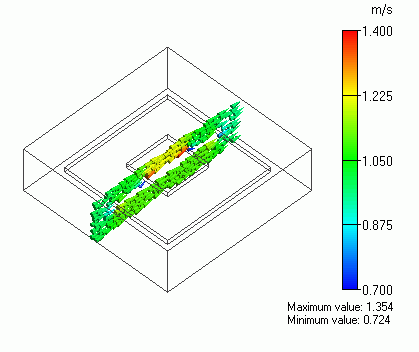
The Vectors of Flow Velocity at a Cross Section |


 at
at 
 .
. Prev Next