Femtet Help/Manual
 

Home / Tutorial / Thermal Analysis (Watt) / 07.View the Results

00

01

02

03

04

05

06

07

08

07.View the Results

The calculation results are available in various formats.
Let's take a look at the temperature by gradation contour and at the cross section.

  • There might be slight differences in results depending on the Femtet version or the PC you use.

Procedure

  1. Check the calculated values.

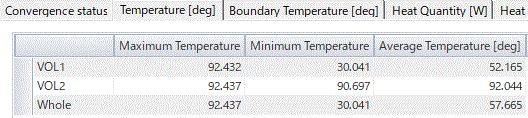
    The temperature (maximum, minimum, average) and heat balance are shown in the table.

  • Tables can be seen by clicking [Table] at on the [Results] tab of the results window.
    The values in the table can be copied and pasted, or exported in CSV.

  1. We take a look at the gradation contour of the temperature.

    On the [Results] tab, go to


    and click [Gradation Contour] .

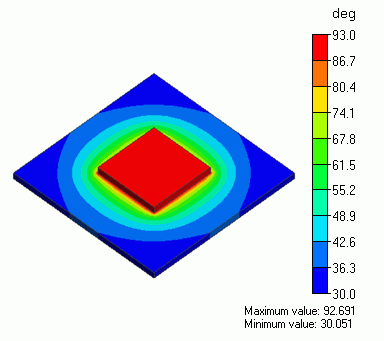
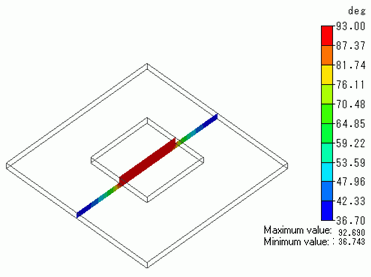
    The gradation contour diagram of the temperature will show up.


  • The setting for the results display such as contour and vector diagram can be registered for later reference.

    The setting is easily applied to other results.

    See [Registering Results Display Setting].

The Gradation Contour of Temperature


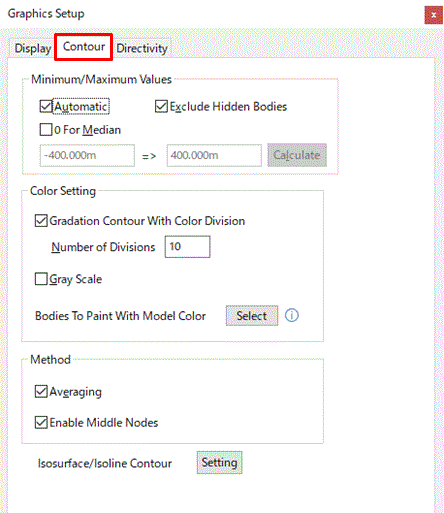
    • To modify the contour display,

      on the [Results] tab, go to


      and click [Graphics Setup] .

      In the [Graphics Setup] dialog box, select [Contour]
      tab,

      and modify the maximum/minimum values, the number of divisions, the colors etc.
       

The Contour tab is explained here 

    • The contour and vector values of a particular point can be obtained

      by specifying the coordinates.

      On the [Results]
      tab, go to

      ,

      and click [Results at Specified Coordinates] .


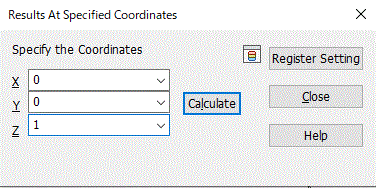
The [Results at Specified Coordinates] dialog box will show up.

Enter the coordinates of your interest and click the [Calculate] button.
 

See [Results at Specified Coordinates] for more information.


The contour and vector values for the currently chosen field will be shown on Output Window.


  1. Let's take a look at the results at the cross section.

    On the [Results]
    tab, go to


    and click [Show Cross Section] .

    The [Cross Section] dialog box will show up.


  1. In the [Cross Section] dialog box, select Simple Mode.

    Select [Enable Preview] and click [YZ plane]
    .
    Click [Close].
     

  • If [Detailed Mode] is selected, multiple cross sections and the surface can be displayed simultaneously.


The cross section will show up.

Cross Section

Prev Next