CAE Software【Femtet】Murata Software Co., Ltd.
Example4 Forced-outflow Fan
General
-
Fan boundary condition is applied to the model used in the tutorial.
See Boundary Condition of Fluid Analysis for the details of the fan boundary condition.
-
Unless specified in the list below, the default conditions will be applied.
Analysis Space
|
Item |
Setting |
|
Analysis Space |
3D |
|
Model unit |
mm |
Analysis Condition
|
Item |
Tab |
Setting |
|
Solver |
Solver selection |
Fluid Analysis [Bernoulli] |
|
Analysis Type |
Fluid Analysis |
Steady-state analysis |
|
Meshing Setup |
Mesh |
General mesh size: 6[mm] |
Model

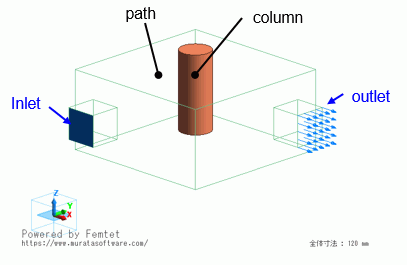
Body Attributes and Materials
|
Body Number/Type |
Body Attribute Name |
Material name |
|
3/Solid |
Path |
000_Air(*) |
|
4/Solid |
column |
007_Fe * |
* Available from the material DB
Boundary Condition
|
Boundary Condition Name/Topology |
Tab |
Boundary Condition Type |
Setting |
|||||||||
|
Inlet/Edge |
Fluid |
Inlet |
Natural Inflow |
|||||||||
|
Outlet/Face |
Fluid |
Outlet |
Forced Outflow PQ Characteristics
|
Results
The figure below is the contour of [total pressure] field.
The integration results at the inlet and outlet boundary faces are shown as well. (Selected faces are integrated by the right-click menu)

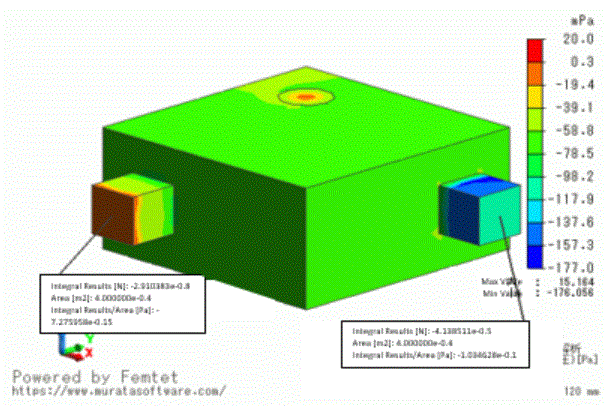
The total pressure is nearly zero on the natural inflow boundary. On the forced-outflow fan boundary, it is -0.1034[Pa] which is calculated from the PQ characteristics.
The tables of the volumetric flow rate and the pressure loss are as follows.

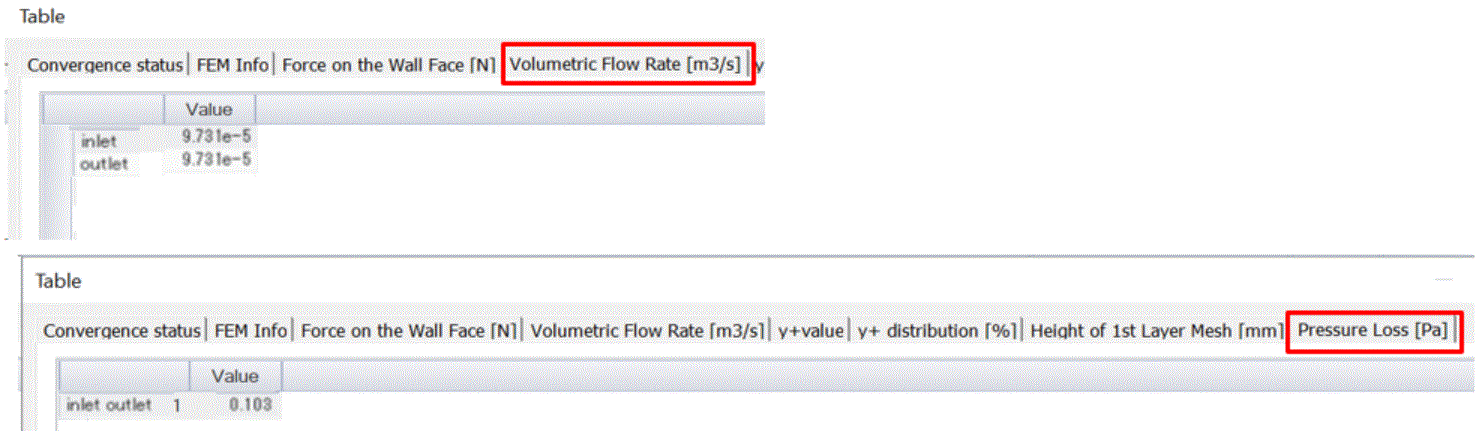
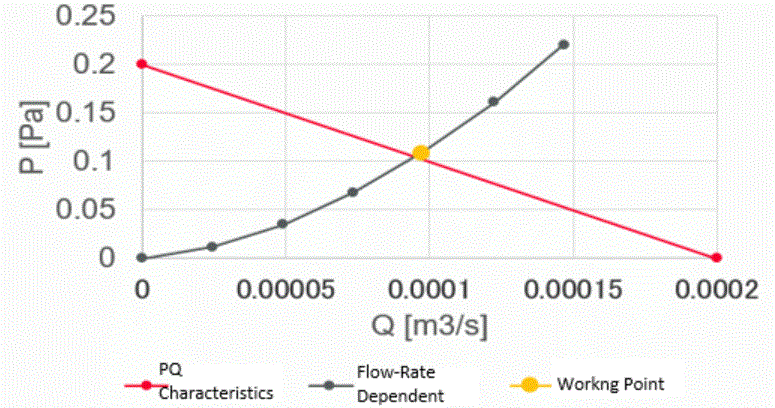
The differential pressure is calculated with PQ characteristics from the table of the volumetric flow rate of outlet boundary.
P = 0.2 – 0.2/2e-4 * 9.731e-5 = 0.1027
The calculation result matches with the values in the contour of the total pressure and in the table of the pressure loss.
The PQ characteristics and the working point (volumetric flow rate:Q and pressure loss: P) are plotted as below.
It is confirmed that the working point is on the PQ characteristics curve.
The flow-rate dependent curve of the pressure loss is also shown below for reference. The curve is calculated with the volumetric flow rate between 2.5e-5 and 1.5e-4.
The two curves are crossing at the working point.
-
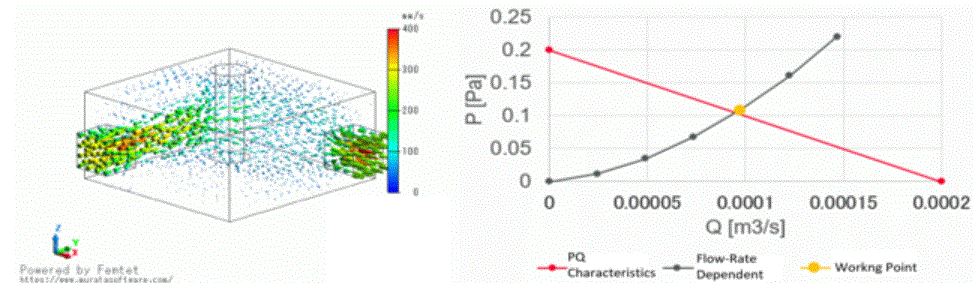
The flow-rate dependent curve of the pressure loss is obtained by the attached project [analysis model_reference].
– Opens a project file.
– Switch the analysis model to [analysis model_reference].
– Execute the parametric analysis.
– The results of the flow rate and the pressure loss are saved in a csv file.