CAE Software【Femtet】Murata Software Co., Ltd.

Example31 Material with Temperature-Dependent Anisotropic Elasticity
General
-
The material has the temperature-dependent anisotropic elasticity. The deformation under thermal load is analyzed.
-
Multi-step thermal load analysis is performed. There are multiple reached temperatures. The stresses for each temperature are solved.
-
Unless specified in the list below, the default conditions will be applied.
Analysis Space
|
Item |
Settings |
|
Analysis Space |
3D |
|
Model unit |
mm |
Analysis Conditions
The temperature is applied evenly on the model.
Opt for the thermal load in the analysis condition, and set the reference temperature and the reached temperature.
There is no need to couple with the thermal analysis [Watt].
|
Item |
Settings |
|
Solvers |
Mechanical Stress Analysis [Galileo] |
|
Analysis Type |
Static analysis |
|
Options |
Select “Thermal load”. |
The Step/Thermal Load tab is set as follows.
In this setting, thermal load analysis is performed with 3 reached temperatures step by step.
|
Tab |
Setting Item |
Settings |
|||||||||||
|
Step/Thermal Load |
Step Setting |
Multi-step thermal load analysis |
|||||||||||
|
Reference temperature |
25[deg] |
||||||||||||
|
Step/Reached Temperature Setting |
|
Model
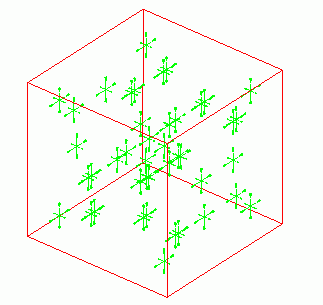
The model is a cubic solid body. The material has the temperature-dependent anisotropic coefficient of expansion. The outer boundary condition is
set with no displacement.
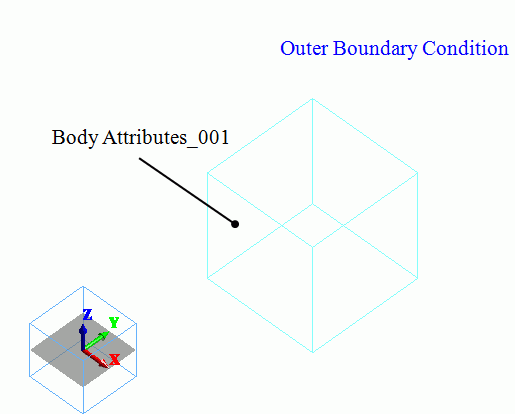
Body Attributes and Materials
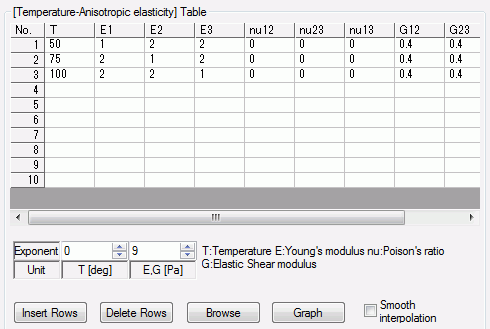
The material properties are set up as follows: The temperature dependency for the elasticity is set for 50, 75, and 100 [deg].
|
Material Name |
Tab |
Properties |
|
Material_Property_001 |
Elasticity |
Material Type: Elastic/Anisotropic Temperature Dependency: Yes
The temperature dependency of the elasticity is set as follows. Subscripts 1, 2 and 3 indicate x, y and z components respectively.
* This is not the actual material’s property. |
|
Coefficient of Expansion |
Temperature Dependency: No Anisotropy: Isotropic Coefficient of Expansion : 10×10^-6[1/deg]
|
Boundary Conditions
|
Boundary Condition Name/Topology |
Tab |
Boundary Condition Type |
Settings |
|
Outer Boundary Condition |
Mechanical |
Displacement |
Select all X/Y/Z components. UX=0, UY=0, UZ=0 |
Results
The figure below shows the principal stress at 50 deg.
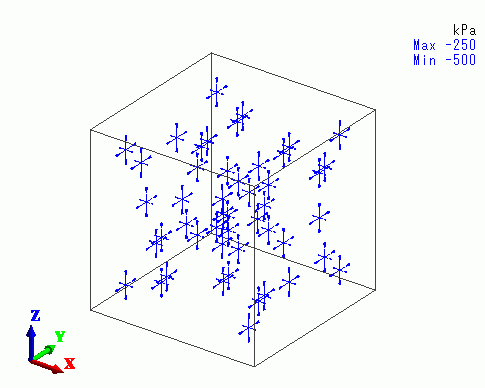
At 50 deg, the compressive stress is smaller in X direction, as the X component of Young’s modulus is smaller than the others.
The figure below shows the principal stress at 75 deg.
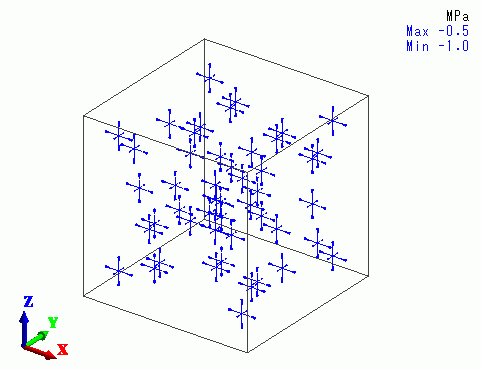
At 75 deg, the compressive stress is smaller in Y direction, as the Y component of Young’s modulus is smaller than the others.
The figure below shows the principal stress at 100 deg.
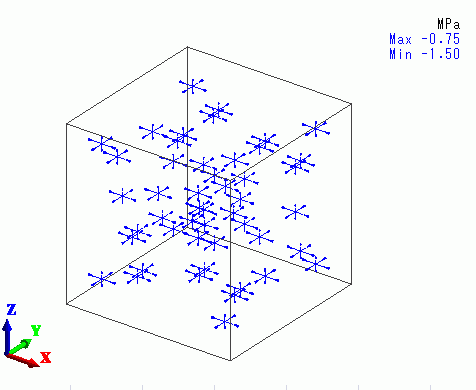
At 100 deg, the compressive stress is smaller in Z direction, as the Z component of Young’s modulus is smaller than the others.


