CAE Software【Femtet】Murata Software Co., Ltd.

Example32 Elastic Collision

General
-
An object collides with another. Transient analysis is performed.
-
The mechanical stresses and the deformations are solved.
-
Unless specified in the list below, the default conditions will be applied.
-
Analysis Space
|
Item |
Setting |
|
Analysis Space |
2D |
|
Model unit |
mm |
Analysis Conditions
To simplify the simulation, the 2D model is created and analyzed.
“Large deformation” is selected, as it is expected.
|
Item |
Setting |
|
Solver |
Mechanical Stress Analysis [Galileo] |
|
Analysis Type |
Transient Analysis |
|
Large Deformation |
Select Large displacement |
The transient analysis is set up as follows.
The time steps after the collision are smaller than those before the collision.
|
Tab |
Setting Item |
Setting |
||||||||||||
|
Transient Analysis |
Table |
|
Graphical Objects

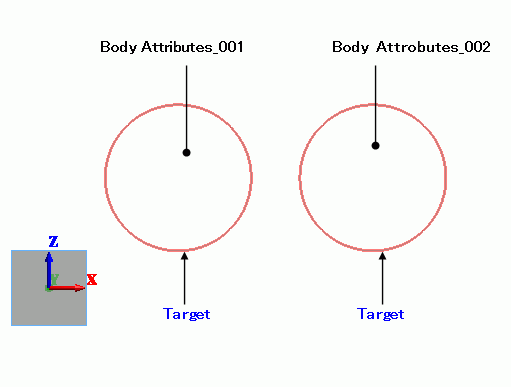
Circular sheet bodies represent objects.
The contactor and contactee surfaces are paired in the “Boundary Pair” dialog box.
Body Attributes and Materials
|
Body Number/Type |
Body Attribute Name |
Material Name |
|
0/Sheet |
Body_Attribute_001 |
005_Polyurethane * |
|
1/Sheet |
Body_Attribute_002 |
005_Polyurethane * |
(*) Available from the Material DB
The initial velocity of the right object is set as follows. That of the left object is 0.
|
Body Attribute Name |
Initial Velocity |
|
Body_Attribute_002 |
X component: -100[m/s] Y and Z components: 0[m/s] |
Boundary Conditions
|
Boundary Condition Name/Topology |
Tab |
Boundary Condition Type |
Setting |
|
Contactor/Edge |
Mechanical |
Contact surface |
Select “Contactor surface”. |
|
Target/Edge |
Mechanical |
Contact surface |
Select “Contactee surface”. |
The contactor and contactee surfaces are designated as a contact pair in the “Boundary Pair” dialog box. In contact analyses, the contact surfaces must be designated as a boundary pair.
Results
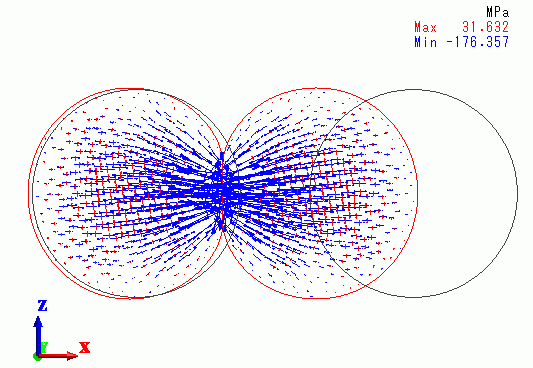
The principal stress distribution at 1.5e-4[s] is shown below.

Large deformations and stresses are exhibited around the contact area.
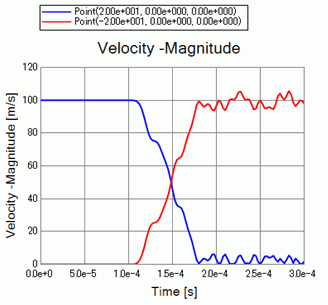
The chart below shows the velocities of 2 objects over time.

The blue and red plots are for the right and left objects respectively.
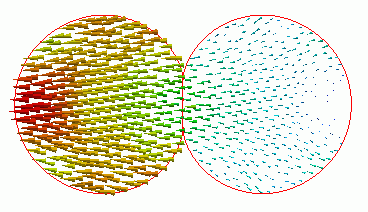
The velocity is transferred from the right object to the left at 1.0e-4[s] through 2.0e-4[s].
This is explained by the theory of elastic collision in which exchange of velocity takes place before and after the elastic collision between objects of the same mass on the straight line.
On the [Results] tab,
click [Create Animation] ![]() . The animation file (.avi) will be created.
. The animation file (.avi) will be created.

