CAE Software【Femtet】Murata Software Co., Ltd.
Example11 Transient Analysis
General
-
Select “Transient resonant analysis” on the Piezoelectric Analysis tab and perform the analysis.
See Piezoelectric Analysis tab for reference.
-
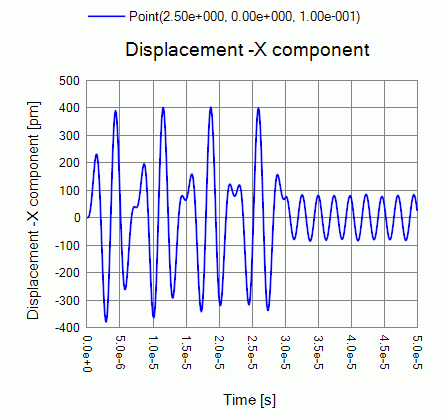
As a result, the displacement change over the time can be viewed.
-
Unless specified in the list below, the default conditions will be applied.
Analysis Space
|
Item |
Settings |
|
Analysis Space |
3D |
|
Model unit |
mm |
Analysis Conditions
For th transient resonant analysis, setting are required for both the resonant and transient analysis tabs.
|
Item |
Settings |
|
Solvers |
Piezoelectric Analysis [Rayleigh] |
|
Analysis Type |
Transient resonant analysis |
The resonant and transient analysis tabs are set up as follows.
|
Tab |
Setting Item |
Settings |
|
Resonant Analysis |
Number of modes |
10 |
|
Approximated frequency |
0[Hz] |
|
|
Transient Analysis |
Time Step |
Select “Manual” |
|
Output steps |
1 |
|
|
Calculation steps |
500 |
Model
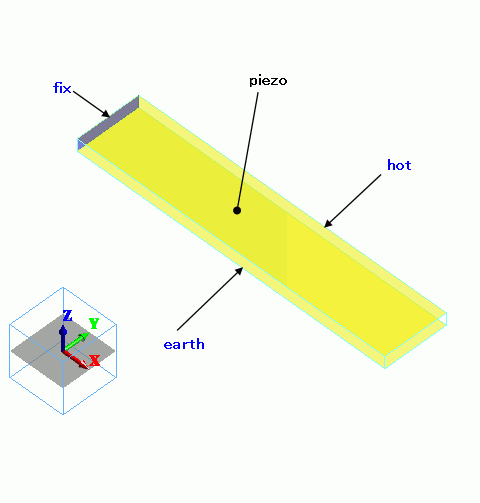
Body Attributes and Materials
|
Body Number/Type |
Body Attribute Name |
Material Name |
|
0/Solid |
piezo |
000_P-4 * |
* Available from the Material DB
Boundary Conditions
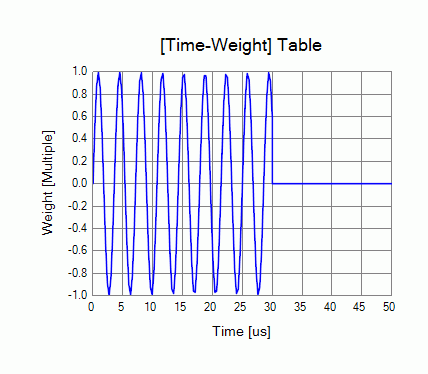
The time dependency of the applied voltage is defined by weight function.
|
Boundary Condition Name/Topology |
Tab |
Boundary Condition Type |
Settings |
|
earth/Face |
Electric |
Electric wall |
Voltage specified: Voltage 0[V] |
|
hot/Face |
Electric |
Electric wall |
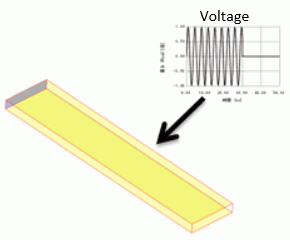
Voltage specified: Voltage 1[V] Select “Time dependency”. Define “Weight function”. |
|
fix/Face |
Mechanical |
Displacement |
UX=0.0, UY=0, UZ=0 |
The weight vs. time is plotted below.
Results
To see the time response, click [Results] -> [Display]. Select “Piezo/Time response” at [Solver], “Displacement” at [Field],
and “X component” at [Component] Then, click [Field Graph] at [Show Results] group and set the dialog box as follows.
Select “Horizontal axis: Mode (frequency, time, step, etc)”. See here for creating graph.
See [Field Graph] for more details.