CAE Software【Femtet】Murata Software Co., Ltd.

Example17 Deformed Meshes

General
-
The impedance change due to thermal load is solved with deformed meshes.
-
This exercise is based on Exercise 9: Thickness Shear Mode.
-
Copy the analysis model of Exercise 9 into the project and name it “Static”. Change the analysis condition to Thermal load and obtain the deformed meshes.
-
Copy the analysis model of Exercise 9 into to project again and name it “Deformed mesh”. This analysis model is solved with the obtained deformed meshes. Analyze the impedance.
Preparation
Open Project “ray_ex09.femprj > Project tree pane > right click on “ray_ex09” > Copy into Project > name it “Static”. Go to Project tree pane again > right click on “ray_ex09” > Copy into Project > name it “Deformed mesh”. There will be 3 analysis models in total.
Analysis Conditions of “Static”
|
Item |
Setting |
|
Solver |
Piezoelectric Analysis [Rayleigh] |
|
Analysis Type |
Static analysis |
|
Options |
Thermal Load |
|
Tab |
Setting Item |
Setting |
|
Thermal Load Tab |
Reached Temperature |
100[deg] |
|
Reference Temperature (Non-Stress Temperature) |
20[deg] |
Analysis Conditions of “Deformed mesh”
|
Item |
Setting |
|
Solver |
Piezoelectric Analysis [Rayleigh] |
|
Analysis Type |
Harmonic Analysis |
|
Options |
N/A |
|
Tab |
Setting Item |
Setting |
|
Harmonic Analysis |
Sweep Values |
Minimum: 18.0×10^6[Hz] Maximum: 18.6×10^6[Hz] |
|
Sweep Type |
Select “Linear step by division number”. Division number: 50 |
Graphical Objects
The same as Exercise 9: Thickness Shear Mode
Body Attributes and Materials
The same as Exercise 9: Thickness Shear Mode except that Coefficient of Expansion is used.
Boundary Condition
The same as Exercise 9: Thickness Shear Mode
Procedure
1) Analysis model “ray_ex09” > Run Mesher/Solver > Save Project. This is for later comparison.
2) Analysis model “Static” > Run Mesher/Solver > Save Project
3) Analysis model “Deformed mesh” > Run Solver with Existing Meshes > Dialog box “Open”
> Folder “ray_ex17.Results” > Select “Static.(Deformed mesh).pdt
> Press the Open button to run the solver > Save Project
Results
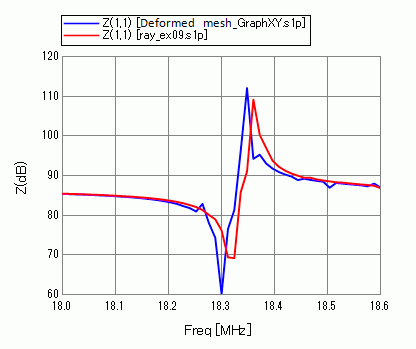
The resonant frequency shifts due to the thermal load.
1) Results window > Chart > SYX Matrix > Descartes window will appear with the frequency plot of impedance
2) Descartes menu > Insert > Add Dataset to All Graphs > Folder “ray_ex17.Results” > Select “ray_09.s1p”
The resulting plots are shown below. The shift of resonant frequency due to the thermal expansion is observed.


