CAE Software【Femtet】Murata Software Co., Ltd.

Example3 Fully Coupled Analysis (Sound Wave Drive)

General
-
The drive from the sound wave domain is analyzed. The sound pressure is solved as the floating electrode voltage of the piezoelectric material.
Analysis Space
|
Item |
Settings |
|
Analysis Space |
3D |
|
Model unit |
m |
Analysis Conditions
|
Item |
Settings |
|
Solvers |
Piezoelectric Analysis [Rayleigh] Acoustic Analysis [Mach] |
|
Analysis Type |
Harmonic analysis |
|
Options |
Select “Fully coupled analysis” |
The harmonic analysis tab is set up as follows.
The sound waves propagate outside the analysis domain. Therefore the “open boundary” condition below is applied initially.
|
Tab |
Setting Item |
Setting |
|
Harmonic Analysis |
Frequency |
10×10^3[Hz] |
|
Sweep Type |
Single frequency |
|
|
Open Boundary Tab |
Type |
Absorbing boundary |
|
Order of Absorbing Boundary |
1st degree |
|
|
Coordinates of Origin |
x = y = z = 0 |
Graphical Objects
Piezoelectric materials are placed around the respiratory sphere used in the Exercise 4. The sound pressure is measured. 5 semicircle piezoelectric materials are placed around the respiratory sphere for measurement. As shown below, one piezoelectric material has ground and floating electrode. The pressure is detected by the voltage of the floating electrode.

Body Attributes and Materials
|
Body Number/Type |
Body Attribute Name |
Material Name |
|
4/Solid |
Air |
000_Air(*) |
|
5/Solid |
Piezoelectric material_000 |
000_P-4 * |
|
6/Solid |
Piezoelectric material_045 |
000_P-4 * |
|
7/Solid |
Piezoelectric material_090 |
000_P-4 * |
|
8/Solid |
Piezoelectric material_135 |
000_P-4 * |
|
9/Soid |
Piezoelectric material_180 |
000_P-4 * |
* Available from the Material DB
Boundary Conditions
|
Boundary Condition Name/Topology |
Tab |
Boundary Condition Type |
Settings |
|
VEL/Face |
Acoustic |
Speed |
1[m/s] |
|
Open/Face |
Acoustic |
Open boundary |
|
|
FIX |
Mechanical |
Displacement |
UX=0, UY=0, UZ=0 |
|
UY0 |
Mechanical |
Displacement |
UY=0 |
|
V0 |
Electric |
Voltage |
0[V] |
|
FLOAT_000~FLOAT_180 |
Electric |
Floating electrode |
|
Results
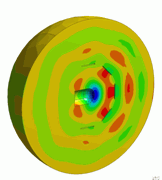
The sound pressure distribution is shown as follows. For comparison purpose, the model with piezoelectric materials removed is shown.

Result 1 (a) The sound pressure distribution of the model with piezoelectric materials removed Result 1 (b)The sound pressure distribution of the model including piezoelectric materials (for reference)
The voltage of the floating electrodes are shown on the right side of the figure.
We can observe that the sound waves are obstructed by the piezoelectric materials.
The figure below is the view in the + X direction of the figure above with piezoelectric materials shown. The colors of the semicircles indicate the floating electrode voltages. The numbers on the right side of the piezoelectric materials are the floating electrode voltages.
The respiratory sphere has large sound pressure and the voltage is large in its front. We can consider that the voltage is obtained corresponding to the sound pressure.


