CAE Software【Femtet】Murata Software Co., Ltd.
Example16 Radiation Blocked by a Disc (Steady-State Analysis)
General
-
A disc is inserted in a space created by two plates.The heat radiation from a plate to the other is blocked by the disc.
-
The temperature distribution and the heat flux vectors are solved.
-
Unless specified in the list below, the default conditions will be applied.
Analysis Space
|
Item |
Settings |
|
Analysis Space |
3D |
|
Model unit |
mm |
Analysis Conditions
|
Item |
Settings |
|
Solvers |
Thermal Analysis [Watt] |
|
Analysis Type |
Steady-state analysis |
|
Options |
N/A |
Model
A disc is placed in between two plates.
The temperature of the bottom face of the lower plate is fixed at 1000[deg]. The top face of the upper plate is set with natural convection.
How the disc affects the radiation is analyzed.
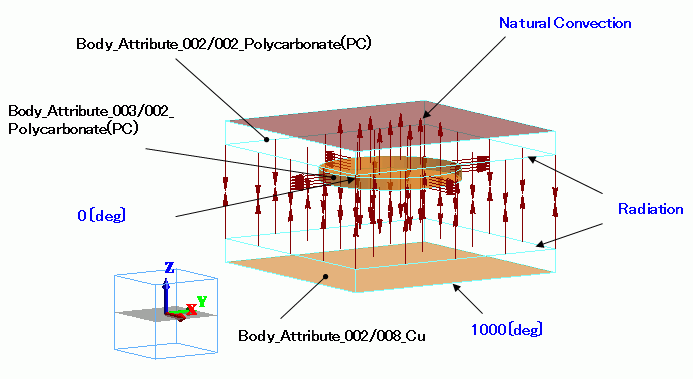
Body Attributes and Materials
|
Body Number/Type |
Body Attribute Name |
Material Name |
|
0/Solid |
Body_Attribute_001 |
008_Cu |
|
1/Solid |
Body_Attribute_003 |
002_Polycarbonate(PC) |
|
2/Solid |
Body_Attribute_002 |
002_Polycarbonate(PC) |
Boundary Conditions
The boundary conditions are set as follows:
|
Boundary Condition Name/Topology |
Tab |
Boundary Condition Type |
Settings |
|
Radiation/Face |
Thermal |
Body-to-body radiation |
Radiation rate: 0.5 Ambient temperature out of the radiation group: 25[deg] |
|
Radiation2/Face |
Thermal |
Body-to-body radiation |
Radiation rate: 0.99 Ambient temperature out of the radiation group: 25[deg] |
|
HighTemperatureWall/Face |
Thermal |
Temperature |
1000[deg] |
|
0/Face |
Thermal |
Temperature |
0[deg] |
|
NaturalConvection/Face |
Thermal |
Heat Transfer/Ambient Radiation |
Natural convection (automatic calculation) Room temperature 25[deg] |
Results
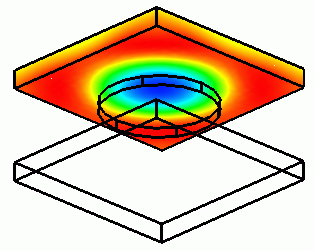
The diagram below shows the temperature distribution of the upper plate.
The other bodies are hidden for the results display, and “Exclude hidden bodies” is selected at Minimum/Maximum Values on the Contour tab of Graphics Setup.
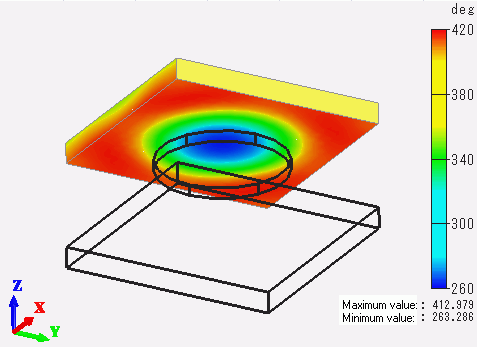
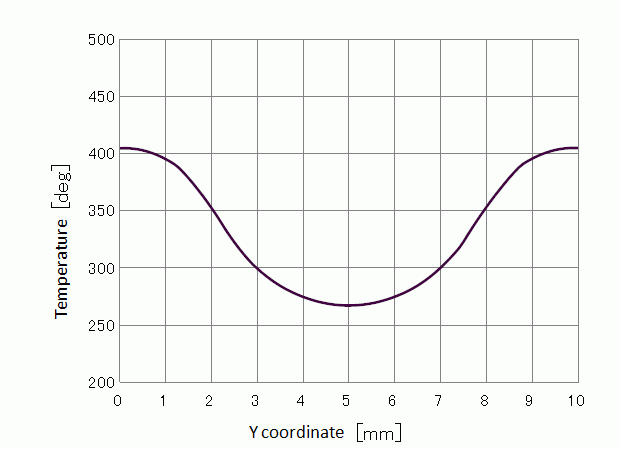
The center area is around 260[deg] whereas the other area is over 400[deg].
The disc is blocking the heat radiation.
The plot below indicates the temperature across the two points: (5, 0, 5) and (5, 10,5).