Home / Tutorial / Acoustic Analysis (Mach) / 09.Show the Directivity
09.Show the Directivity
Let's show the directivity of the sound pressure at the point, 100 m away from the origin.
Procedure
-
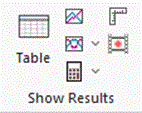 includes [Show Characteristics Chart] includes [Show Characteristics Chart]  . Click ▼ at the side of it. . Click ▼ at the side of it.
Select [Directivity Graph] on the submenu.
|
|
-
The [Sound Waves Directivity] dialog box will show up.
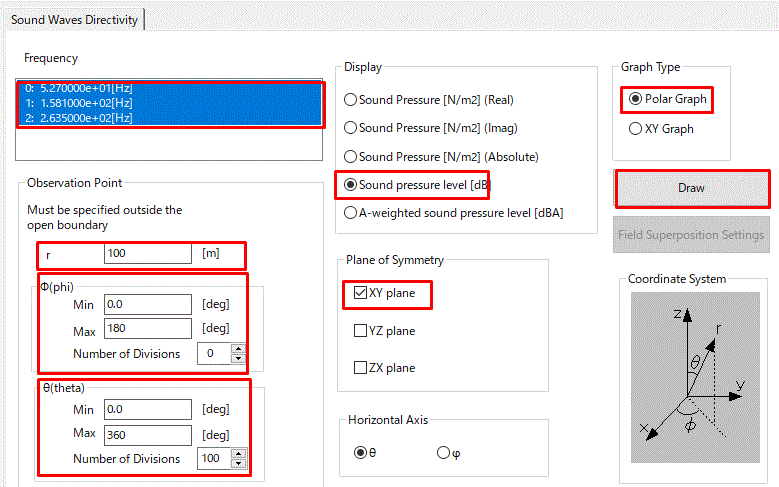
In the [Sound Waves Directivity] dialog box, Set the parameters as follows:
Observation Point
r: 100[m]
φ: all 0
θ:
min 0.0[deg]
max 360[deg]
step 100
Display: Sound pressure level [dB]
Symmetry Face: XY plane
Select the mode frequency and clck [Polar Graph].
To easily check the difference due to frequencies, select multiple frequencies in the right diagram to display corresponding graphs.
To select multiple frequencies, select frequencies while pressing the <Shift> key or <Ctrl> key.
|
|
-
The polar graph of directivity will be shown for each frequency.
-
The sound pressure tends to be more directive at the higher driving frequencies.
-
To get the same graphs as the right figure, R-axis setting is required to be modified. The setting of the right figure is as follows:
R axis Min 0
R axis Max 200
R axis Interval 50
|
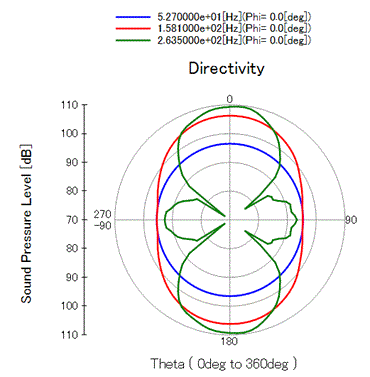
The Polar Graph of Directivity of Sound Pressure Level
|


 Prev Next