CAE Software【Femtet】Murata Software Co., Ltd.
- Top
- Product<
- Applications
- Transient Analysis Using Temperature Distribution in a Steady State
Application47 Transient Analysis Using Temperature Distribution in a Steady State
The heat source such as IC and LED on a substrate is switched off and cooled in the natural or forced convection. Time response of the cooling is analyzed.
An analysis model is shown in Fig. 1. Two heat sources are placed on a substrate. At first, steady-state analysis is performed. The resulting temperature distribution is obtained by a function of "Result Import," and used for a transient analysis. Two heat sources are set to zero and time response of the temperature assuming the natural cooling is calculated in the transient analysis.
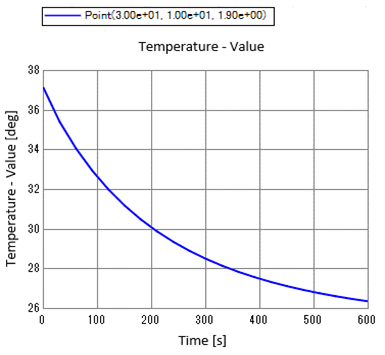
Fig. 2 shows the temperature distribution by two heat sources in the steady-state analysis. Fig. 3 is a setup of "Result Import". In Fig. 4, time response of temperature is plotted. As the graph shows, the temperature falls with time. Like this example, "Result Import" function allows more practical analysis of the temperature behavior.
Fig. 1: Analysis Model
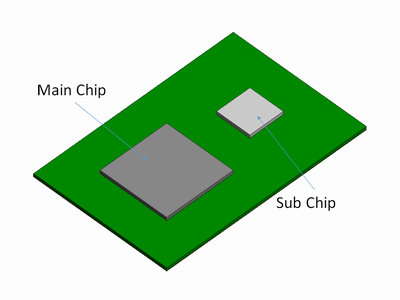
Fig. 2: Steady-state Analysis Result
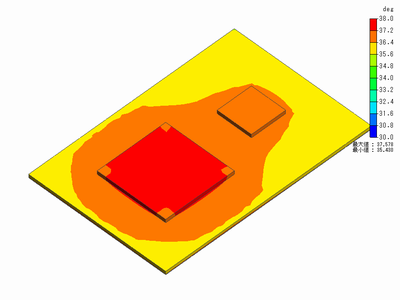
Fig. 3: Result Import Setting
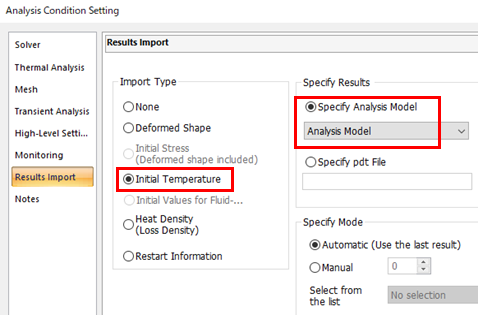
Fig. 4: Time Response of Temperature