CAE Software【Femtet】Murata Software Co., Ltd.

Example11 Interference of Sound Waves(2D Transient Analysis)

General
-
The harmonic analysis of the interference in the Example 3 is reproduced by the transient analysis.
-
We will confirm that the sound pressure distribution shifts to the steady state over time and the result matches with that of the harmonic analysis.
-
Unless specified in the list below, the default conditions will be applied.
Analysis Space
|
Item |
Setting |
|
Analysis Space |
2D |
|
Model Unit |
m |
Analysis Conditions
Analysis conditions for the transient analysis are listed below.
|
Item |
Setting |
|
Solver |
Acoustic analysis [Mach] |
|
Analysis Type |
Transient Analysis |
|
Options |
N/A |
The analysis conditions for the harmonic analysis are mostly the same as Example 3. The difference is that the analysis frequency for comparison is set to 1KHz only.
General mesh size on the Mesh tab is set to 0.02m.
The timestep in the Transient Analysis tab is set up as follows.
By setting the time step to Automatic, the time step width will be automatically set so as not to incur the numerical instability.
The time steps of 20000 and the output steps of 100 will output 200 steps of field data.
|
Tab |
Setting Item |
Setting |
|
Mesh |
General mesh size: | 0.02[m] |
|
Transient Analysis
|
Timestep |
Automatic |
|
Number of steps |
20000 |
|
|
Output steps |
100 |
Model
The model is created in 2D. A semi-circle and two rectangle sheet bodies form the air.
The “speed” boundary condition by the sine wave is set on the sound generators. The “open boundary” is set on the perimeter of the semi circle.
Body Attributes and Materials
|
Body Number/Type |
Body Attribute Name |
Material Name |
|
5/Sheet |
Air |
000_Air(*) |
* Available from the material DB
Boundary Conditions
The boundary conditions of open boundary and speed are set for the transient analysis. The boundary condition used for comparing with the harmonic analysis is the speed boundary (0.01[m/s) which is changed from the pressure boundary in Example 3.
|
Boundary Condition Name/Topology |
Tab |
Boundary Condition Type |
Setting |
|
Open/Face |
Sound wave |
Open boundary |
– |
|
V1/Face |
Sound wave |
Speed (sine wave) |
-0.01[m/s] |
|
V2/Face |
Sound wave |
Speed (sine wave) |
-0.01[m/s] |
Results
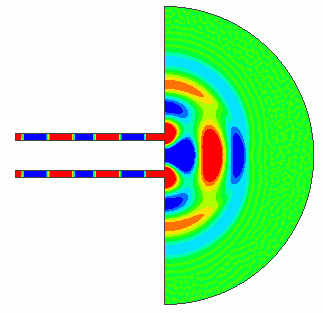
The gradation contour diagrams of the particle velocities are shown below. The diagrams show the 10th, 25th, and 40th step of the transient analysis.
For easy viewing, the maximum and minimum values are set to 10[mm/s] and 0 [mm/s] respectively in the gradient contour diagram setting.
Please note that the time at each step depends on the mesh if the time step is set to automatic.
Below is an approximate time with the general mesh size of 0.02[m].
10th Step [1.55ms]
25th Step [3.86ms]
40th Step [6.18ms]
It can be observed that the interference pattern is generated by the propagating sound waves over time.
The contour diagrams below are the results of the harmonic analysis with the same analysis conditions as the transient analysis.
170th Step [26.3ms] Harmonic Analysis [1KHz, phase 0°]
The graph of radiation energy below shows the steady state is almost reached at time=25ms on ( approximately 160th step).
The gradation contour diagram of the particle velocity at the 170the step, which is in the steady state, is almost the same as that of the harmonic analysis.
It is verified that the results of the transient analysis are correct.
(Note: The results of the transient analysis change over time. It is not the case that the results after reaching the steady state match with those of the harmonic analysis at all times.)
The result matches with a phase somewhere in the results of the harmonic analysis. In the case above, the result in the phase 0° is the same as that in the 170th step.)

