The calculation results are available in various format.
Let's take a look at the vectors and the gradation contour, the displacement, the cross section and some other graphs and charts.
-
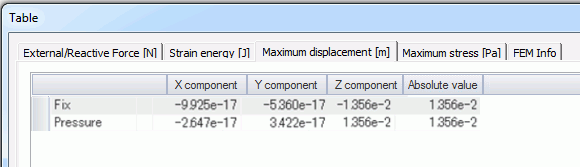
Check the calculated values.
The results such as external/reactive forces, the strain energies, etc are summarized on tables.
|
|
-
Let's see the vectors of the displacement.
On the [Results] tab, go to

and click [Element Vector]  . The vector diagram will show up. . The vector diagram will show up.
-
The default field type  is Displacement. is Displacement.
-
The setting for the results display can be registered for later reference.
The setting can be easily applied to other results.
See [Registering Results Display Setting].
|
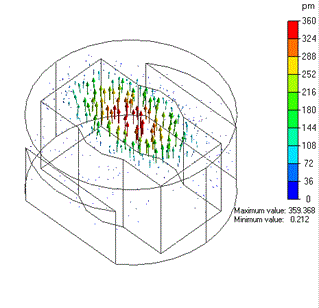
Vector Diagram |
|
-
-
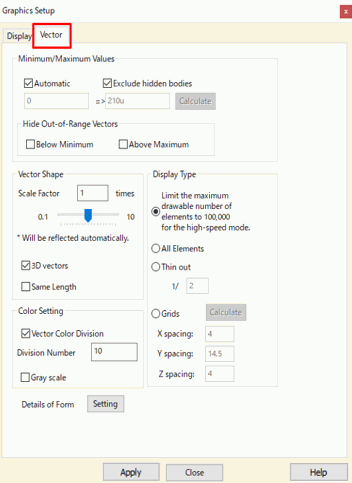
To modify the shape of vectors,
on the [Results] tab, go to

and click [Graphics Setup]  . .
In the [Graphics Setup] dialog box,
select the [Vector] tab,
and modify the magnitude and the shape of vectors.
The Vector tab is explained here
|
|
-
|
|
|
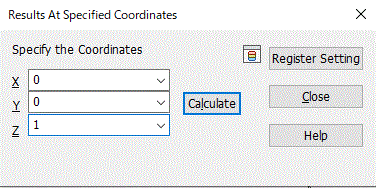
The [Results at Specified Coordinates] dialog box will show up. Enter the coordinates of your interest and click the [Calculate] button.
Results at specified coordinates are explained here
|
|
|
The contour and vector values for the currently chosen field will be shown on .
|
|
-
Let's take a look at the gradation contour of the displacement.
On the [Results] tab, go to
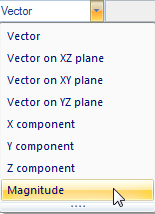
and select Magnitude on the drop-down list at Component  . .
|
|
-
On the [Results] tab, go to

and click [Gradation Contour]  . .
The gradation contour diagram of the displacement will be shown.
The deformation around the center of the case top should be high,
as the displacement is high around there.
|
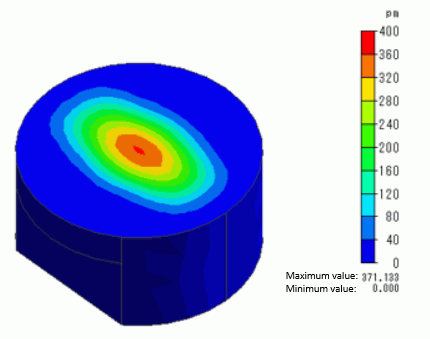
The Gradation Contour of Displacement |
-
Let's look at the displacement.
On the [Results] tab, go to

and click [Displacement Outline]  . .
The displacement diagram will show up.
The deformation around the center is large as expected.
For the better view, the deformation scale is magnified in the diagram.
-
 Press ▼ at the bottom of [ Press ▼ at the bottom of [ Change View] at Viewpoint Operation above. Change View] at Viewpoint Operation above.
Click [Front View]  on the submenu to see it better. on the submenu to see it better.
To go back to the original viewpoint, click [Isometric View] .
|
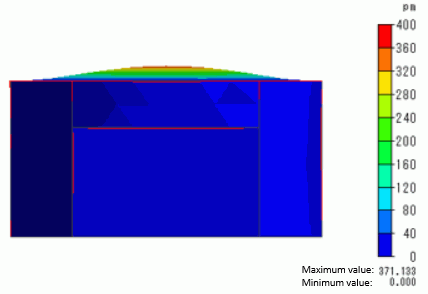
Displacement Diagram |
-
-
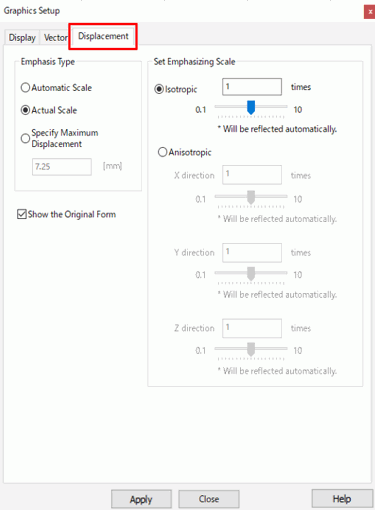
To modify the scale of a displacement diagram,
on the [Results] tab, go to
and click [Graphics Setup] .
In the [Graphics Setup] dialog box,
click [Displacement] tab
Modify the scale ratio.
The Displacement tab is explained here.
|
|
-
Let's take a look at the results at the cross section.
On the [Results] tab, go to

and click [Show Cross Section]  . .
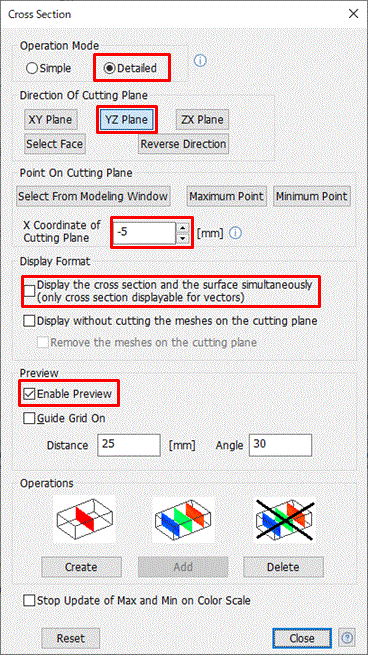
The [Cross Section] dialog box will show up.
|
|
-
Select Detailed Mode in the [Cross Section] dialog box.
Deselect [Display the cross section and the surface simultaneously] and
select [Enable Preview].
Select [YZ Plane] on the [Direction of Cutting Plane] tab and
enter [X Coordinate of Cutting Plane]:-5.
-
Tips on section operations:
To see multiple cross sections, click [Add].
Select [Delete] to remove sections.
If [Simple Mode] is selected, the cross section can be created on the fixed planes of XY, YZ, and ZX.
|
|
|
The cross section diagram will show up. |
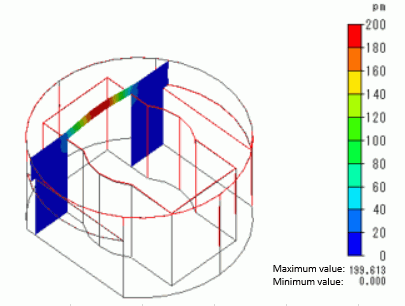
Cross Section |
-
Let's see the contour graph.
On the [Results] tab, go to
and click [Field Graph]  . .
The [Field Graph Setting] dialog box will show up.
|
|
-
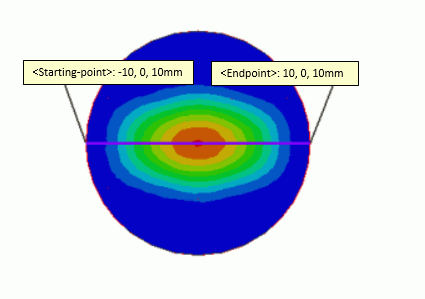
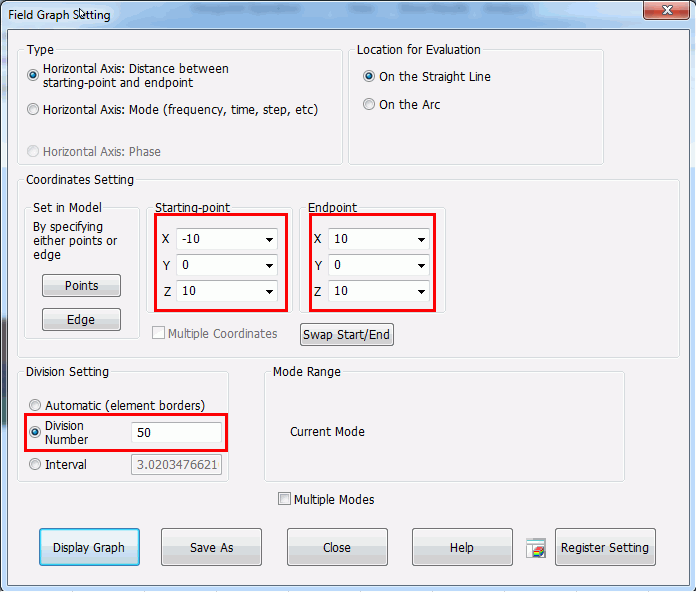
In the [Field Graph Setting] dialog box, specify the coordinates of the startpoint and the endpoint. Then click 
Startpoint (X: -10, Y: 0, Z: 10)
Endpoint (X: 10, Y: 0, Z: 10) Number of Divisions: 50
-
Here, the line segment goes through the center, and the number of plotting points is 50.
|
|
|
The contour graph will show up.
Click  in the [Field Graph Setting] dialog box and exit. in the [Field Graph Setting] dialog box and exit.
|
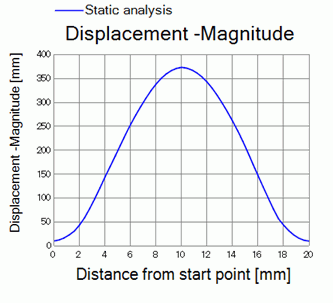
The Displacement Plot |
-
Let's terminate the display of the cross sections.
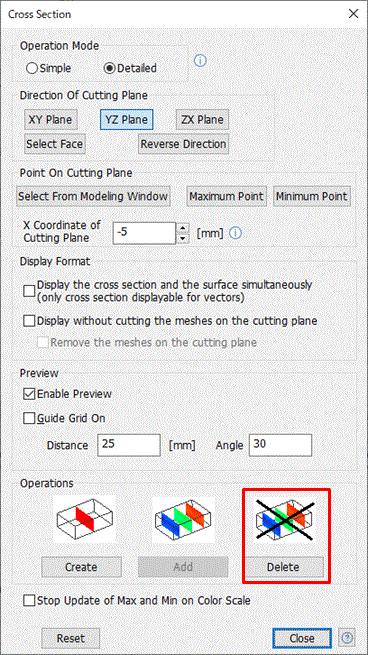
Click [Delete] in the [Cross Section] dialog box.
Click [Close] to exit.
-
To activate the [Cross Section] dialog box, click ▼ at the side of [Show Cross Section] ,
and click [Set up Cross Section]  on the submenu. The [Cross Section] dialog box will show up. on the submenu. The [Cross Section] dialog box will show up.
|
|
-
Let's see the vector diagram of the stress.
On the [Results] tab, go to
,
select Stress on the drop-down list at [Field] ,
and select Principal stress on the drop-down list at [Component]  . .
|
|
-
On the [Results] tab, go to

and click [Element Vector] . The vector diagram will show up.
-
For better view, click [Mesh]  , and hide the meshes. , and hide the meshes.
-
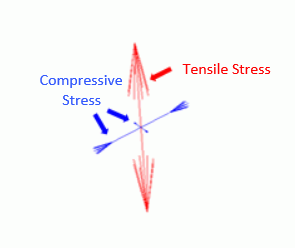
Vectors are displayed as the set of 3 vectors.
These 3 vectors correspond to the 3 principal stresses.
When a force is applied to an object, there is always a face where the shearing force is nil.
That normal stress is called the principal stress.
With the Calculation at Specified Coordinates function, the principal stress at the user-specified coordinates will be shown for maximum, medium and minimum values:
each corresponding to the maximum principal stress, the medium principal stress and the minimum principal stress.
The stress is positive for tension and negative for compression.
|
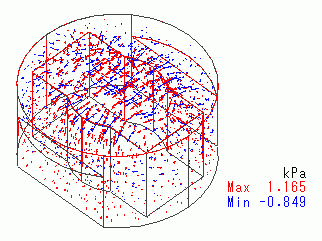
The Vectors of Principal Stress |
-
Let's take a look at the gradation contour of the stress.
On the [Results] tab, go to

and select [Maximum principal stress] on the drop-down list at [Component] .
|
|
-
On the [Results] tab, go to

and click [Gradation Contour] .
The gradation contour diagram of the displacement will be shown.
(The displacement and the contour graph for the maximum principal stress can be shown in the similar way as the displacement)
|
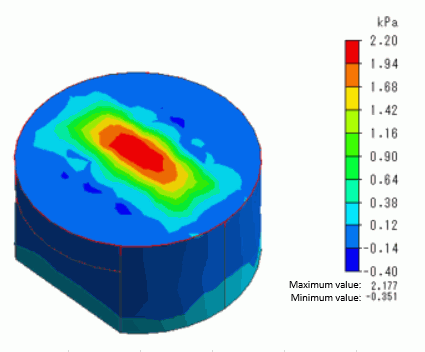
The Gradation Contour of Maximum Principal Stress |
|
-
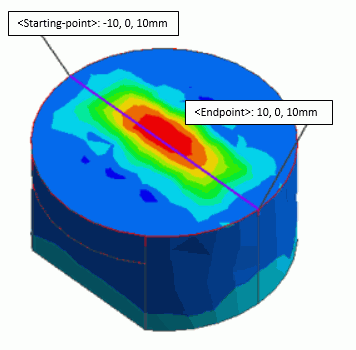
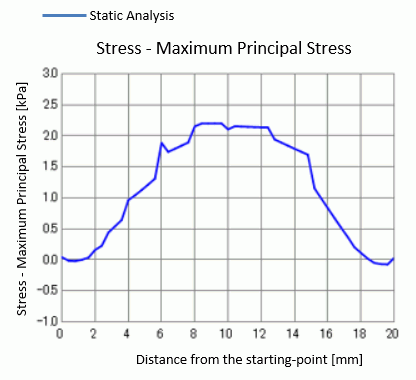
The Plot of Maximum Principal Stress:
The graph indicates the distribution of the maximum principal stress of the case top.
The plot is not smooth.
It is because the stress distribution is not continuous across elements.
|
The Plot of Maximum Principal Stress |


 at
at  .
. Prev
Prev