Home / Tutorial / Electromagnetic Analysis (3D Harmonic Analysis) (Hertz) / 11.View the Results
11.View the Results
The calculation results are available in various format.
Let's see the field vectors, and some graphs and charts.
Procedure
-
Let's see the electric field vectors.
On the [Results] tab, go to

and click [Element Vector]  . .
The electric field vectors will show up.
-
The results display settings such as contour diagram and vector diagram can be registered.
The setting can be easily applied to other results.
See [Registering Results Display Setting].
-
This vector diagram indicates the electromagnetic field when the electromagnetic waves are input at Port_001.
To see the electromagnetic field input at Port_002,
go to the [Model] tab  , ,
click [Field Superposition Setting]  . .
On the appearing dialog box, set as follows
Port_001: MAG=0.0
Port_002: MAG=1.0
|
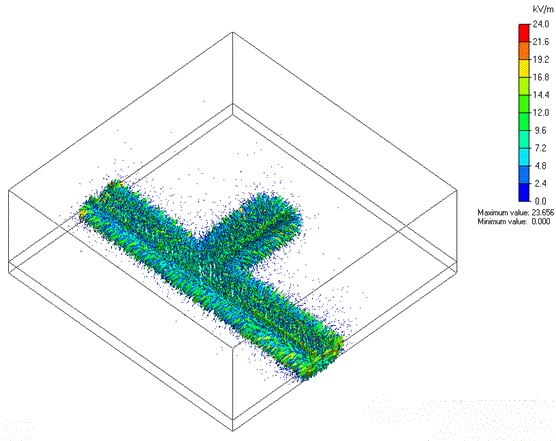
The Vectors of Electric Field |
|
-
-
To modify the shape of vectors,
on the [Results] tab, go to

and click [Graphics Setup]  . .
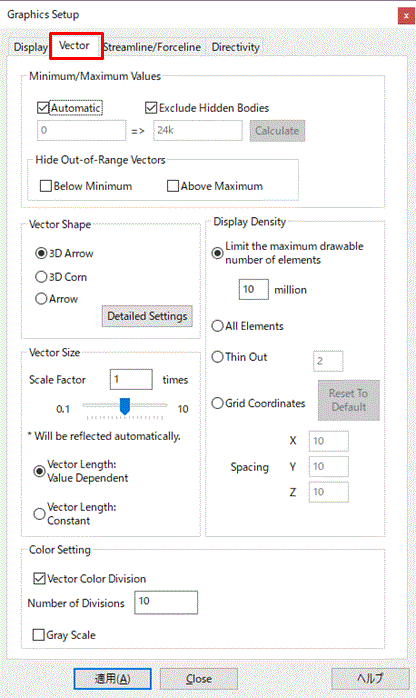
In the [Graphics Setup] dialog box,
select the [Vector] tab,
and modify the magnitude and the shape of vectors.
The Vector tab is explained here
|
|
-
|
|
|
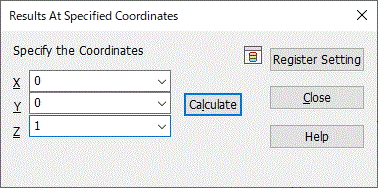
The [Results at Specified Coordinates] dialog box will show up. Enter the coordinates of your interest and click the [Calculate] button.
Results at specified coordinates are explained here
|
|
|
The contour and vector values for the currently chosen field will be shown on .
|
|
-
Let's take a look at S-parameters.
On the [Results] tab, go to 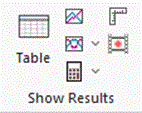 and click ▼ at the side of [Show Characteristics Chart] and click ▼ at the side of [Show Characteristics Chart] . .
Click [SYZ Matrix] on the submenu.
|
|
-
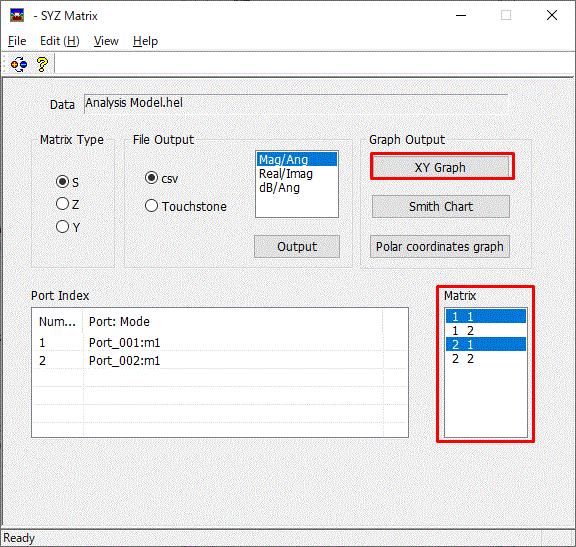
The [SYZ Matrix] dialog box will show up.
Select the following components:
1 1
2 1
and click  . .
-
For the multiple selection, click while pressing the <Ctrl> key.
|
|
|
The frequency plots for S11 and S21 will be shown.
-
Close Descartes Window to continue on.
|
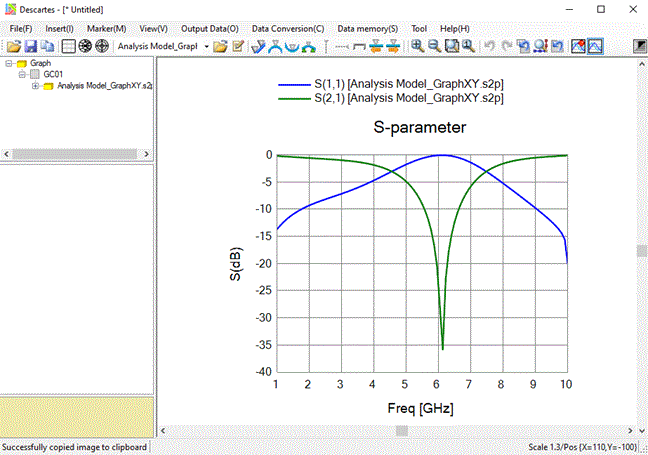
The Frequency Plots of S11 and S21
|
-
Let's see the Smith Chart.
In the [SYZ Matrix] dialog box,
select the following matrix components:
1 1
2 1
and click  . .
|
|
|
Smith Chart will appear. |
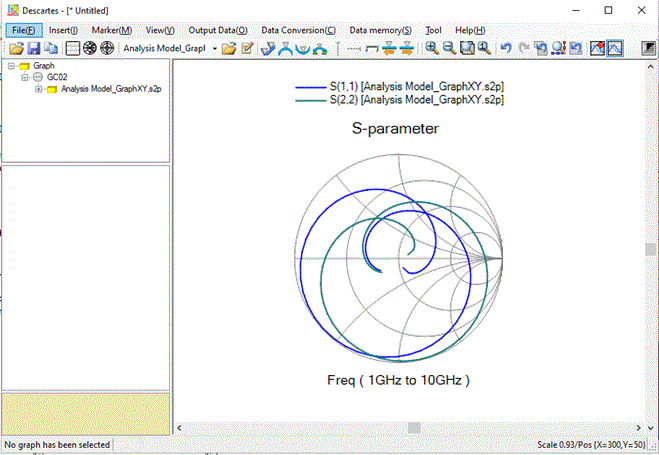
Smith Chart |


 .
. Prev Next